We're happy to help with your standalone charts & dropdown filters in the meantime! Can you share some screenshots?
Here are some potentially helpful resources for the time being
1 Visualize data with the Chart component | Retool Docs
2 When to use double curly brackets {{ }}
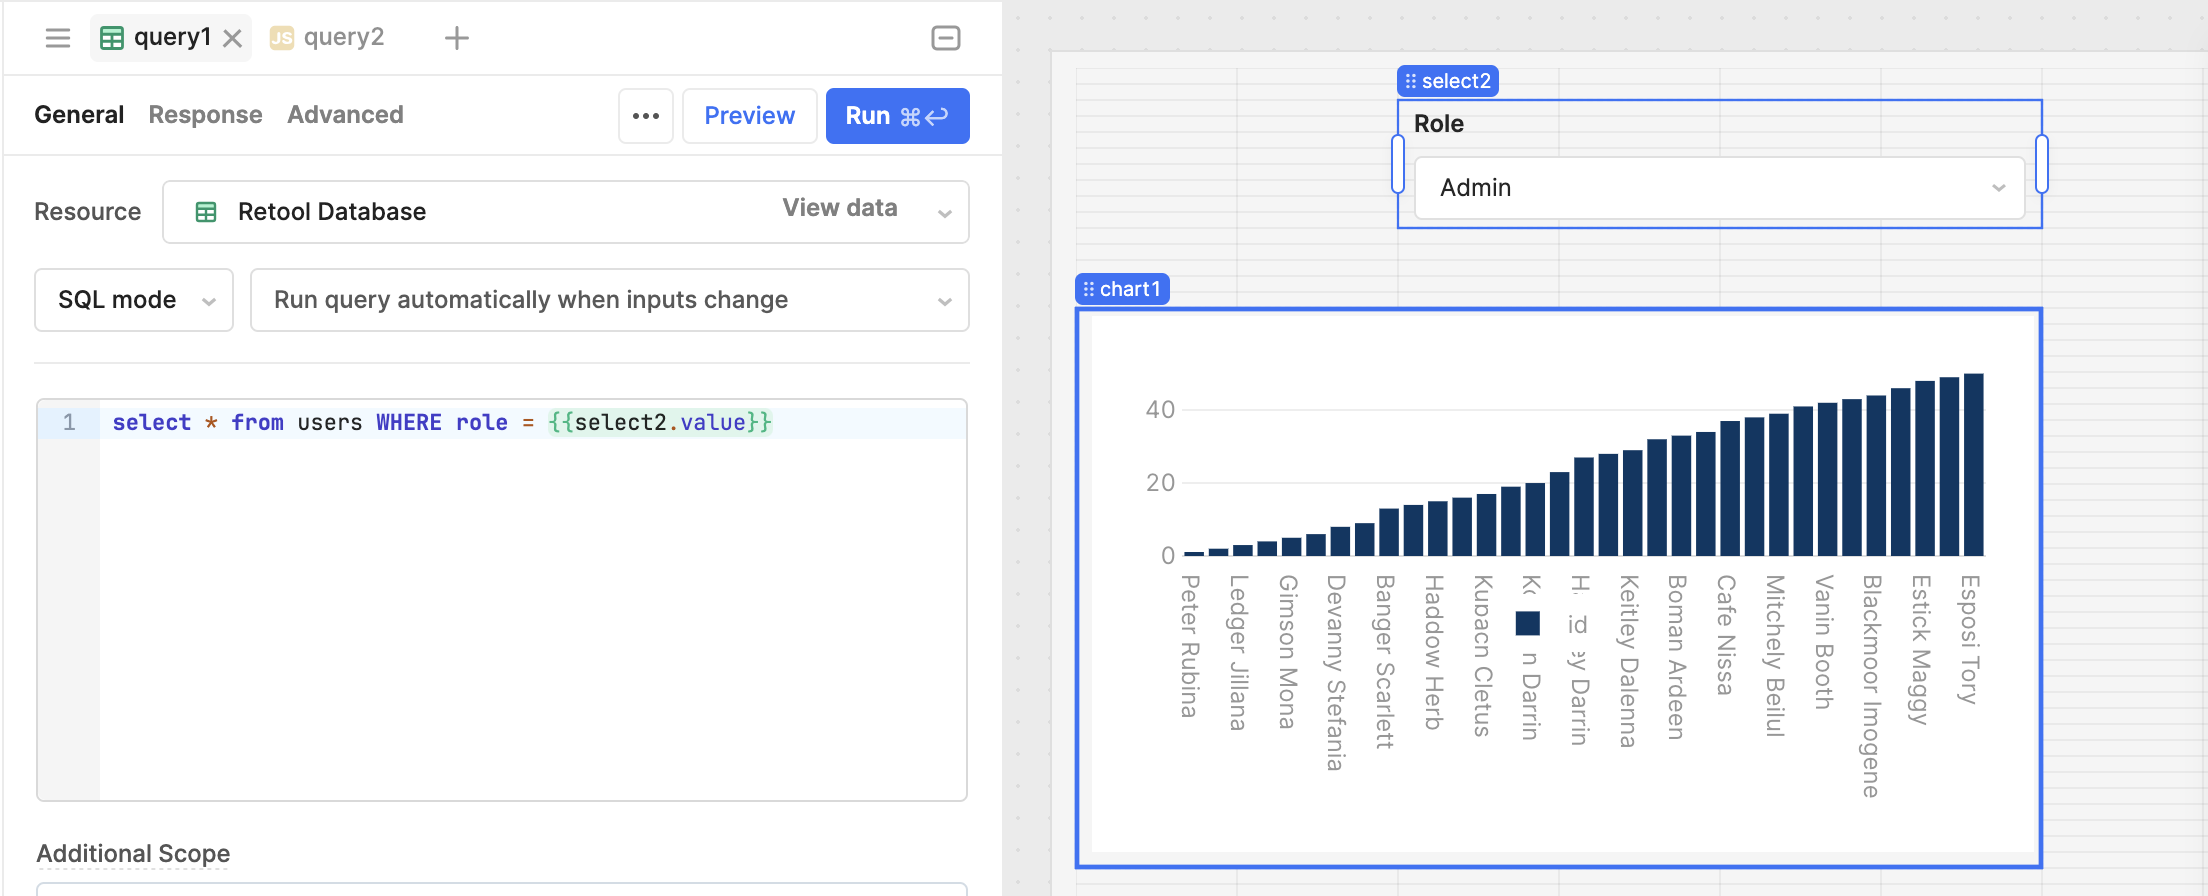
Typically, you'd connect the filter components to the data source (query, transformer, etc) that populates the graph: