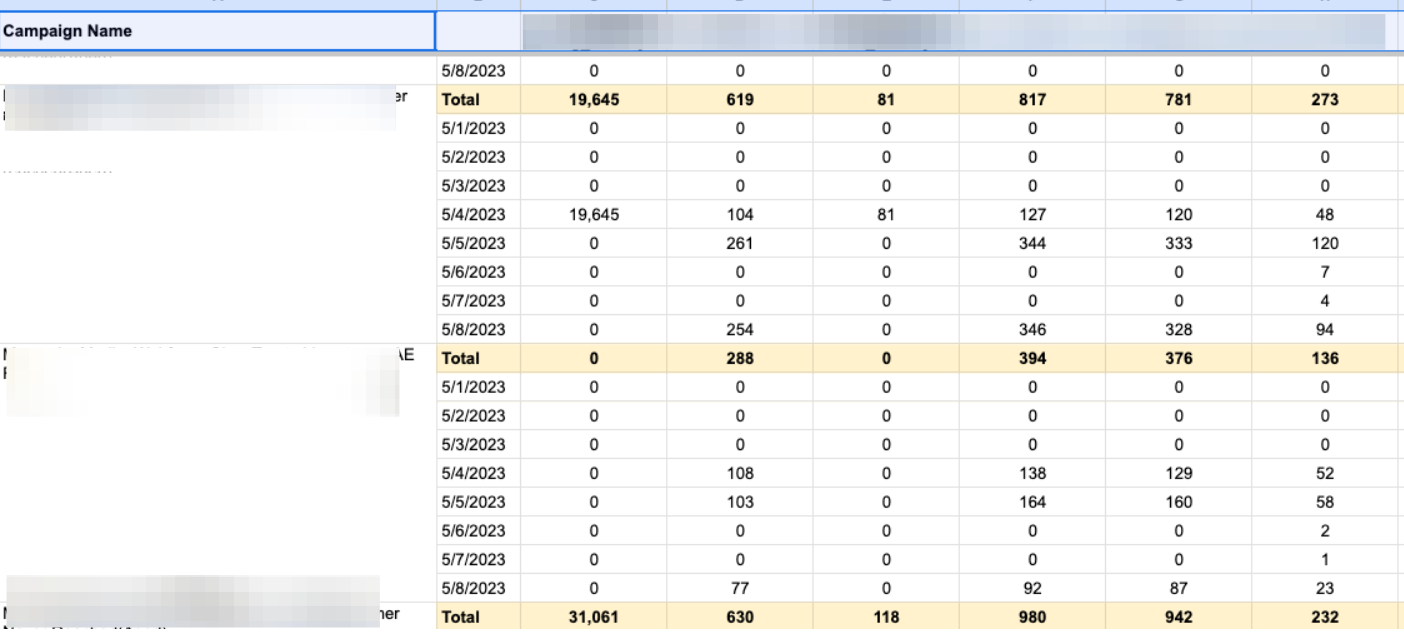
@Kabirdas as explained before, conditional cell color-coding is useful to convey additional info. In our case, we show a tax amount and the color code tells if it's the original tax amount (no color) or if was adjusted/added through a later process (the color tells which one). Without color-coding, we would need add'l columns to convey that info.
Now, while the dev team is at it, in addition to picking what color, it could even go a step further by supporting data bars (preferred) or color scale - see in Excel.
Lastly, a cell-specific tooltip (when you hover over a cell, cell-specific context tooltip pops-up) is very useful to convey details that can't fit in a cell.
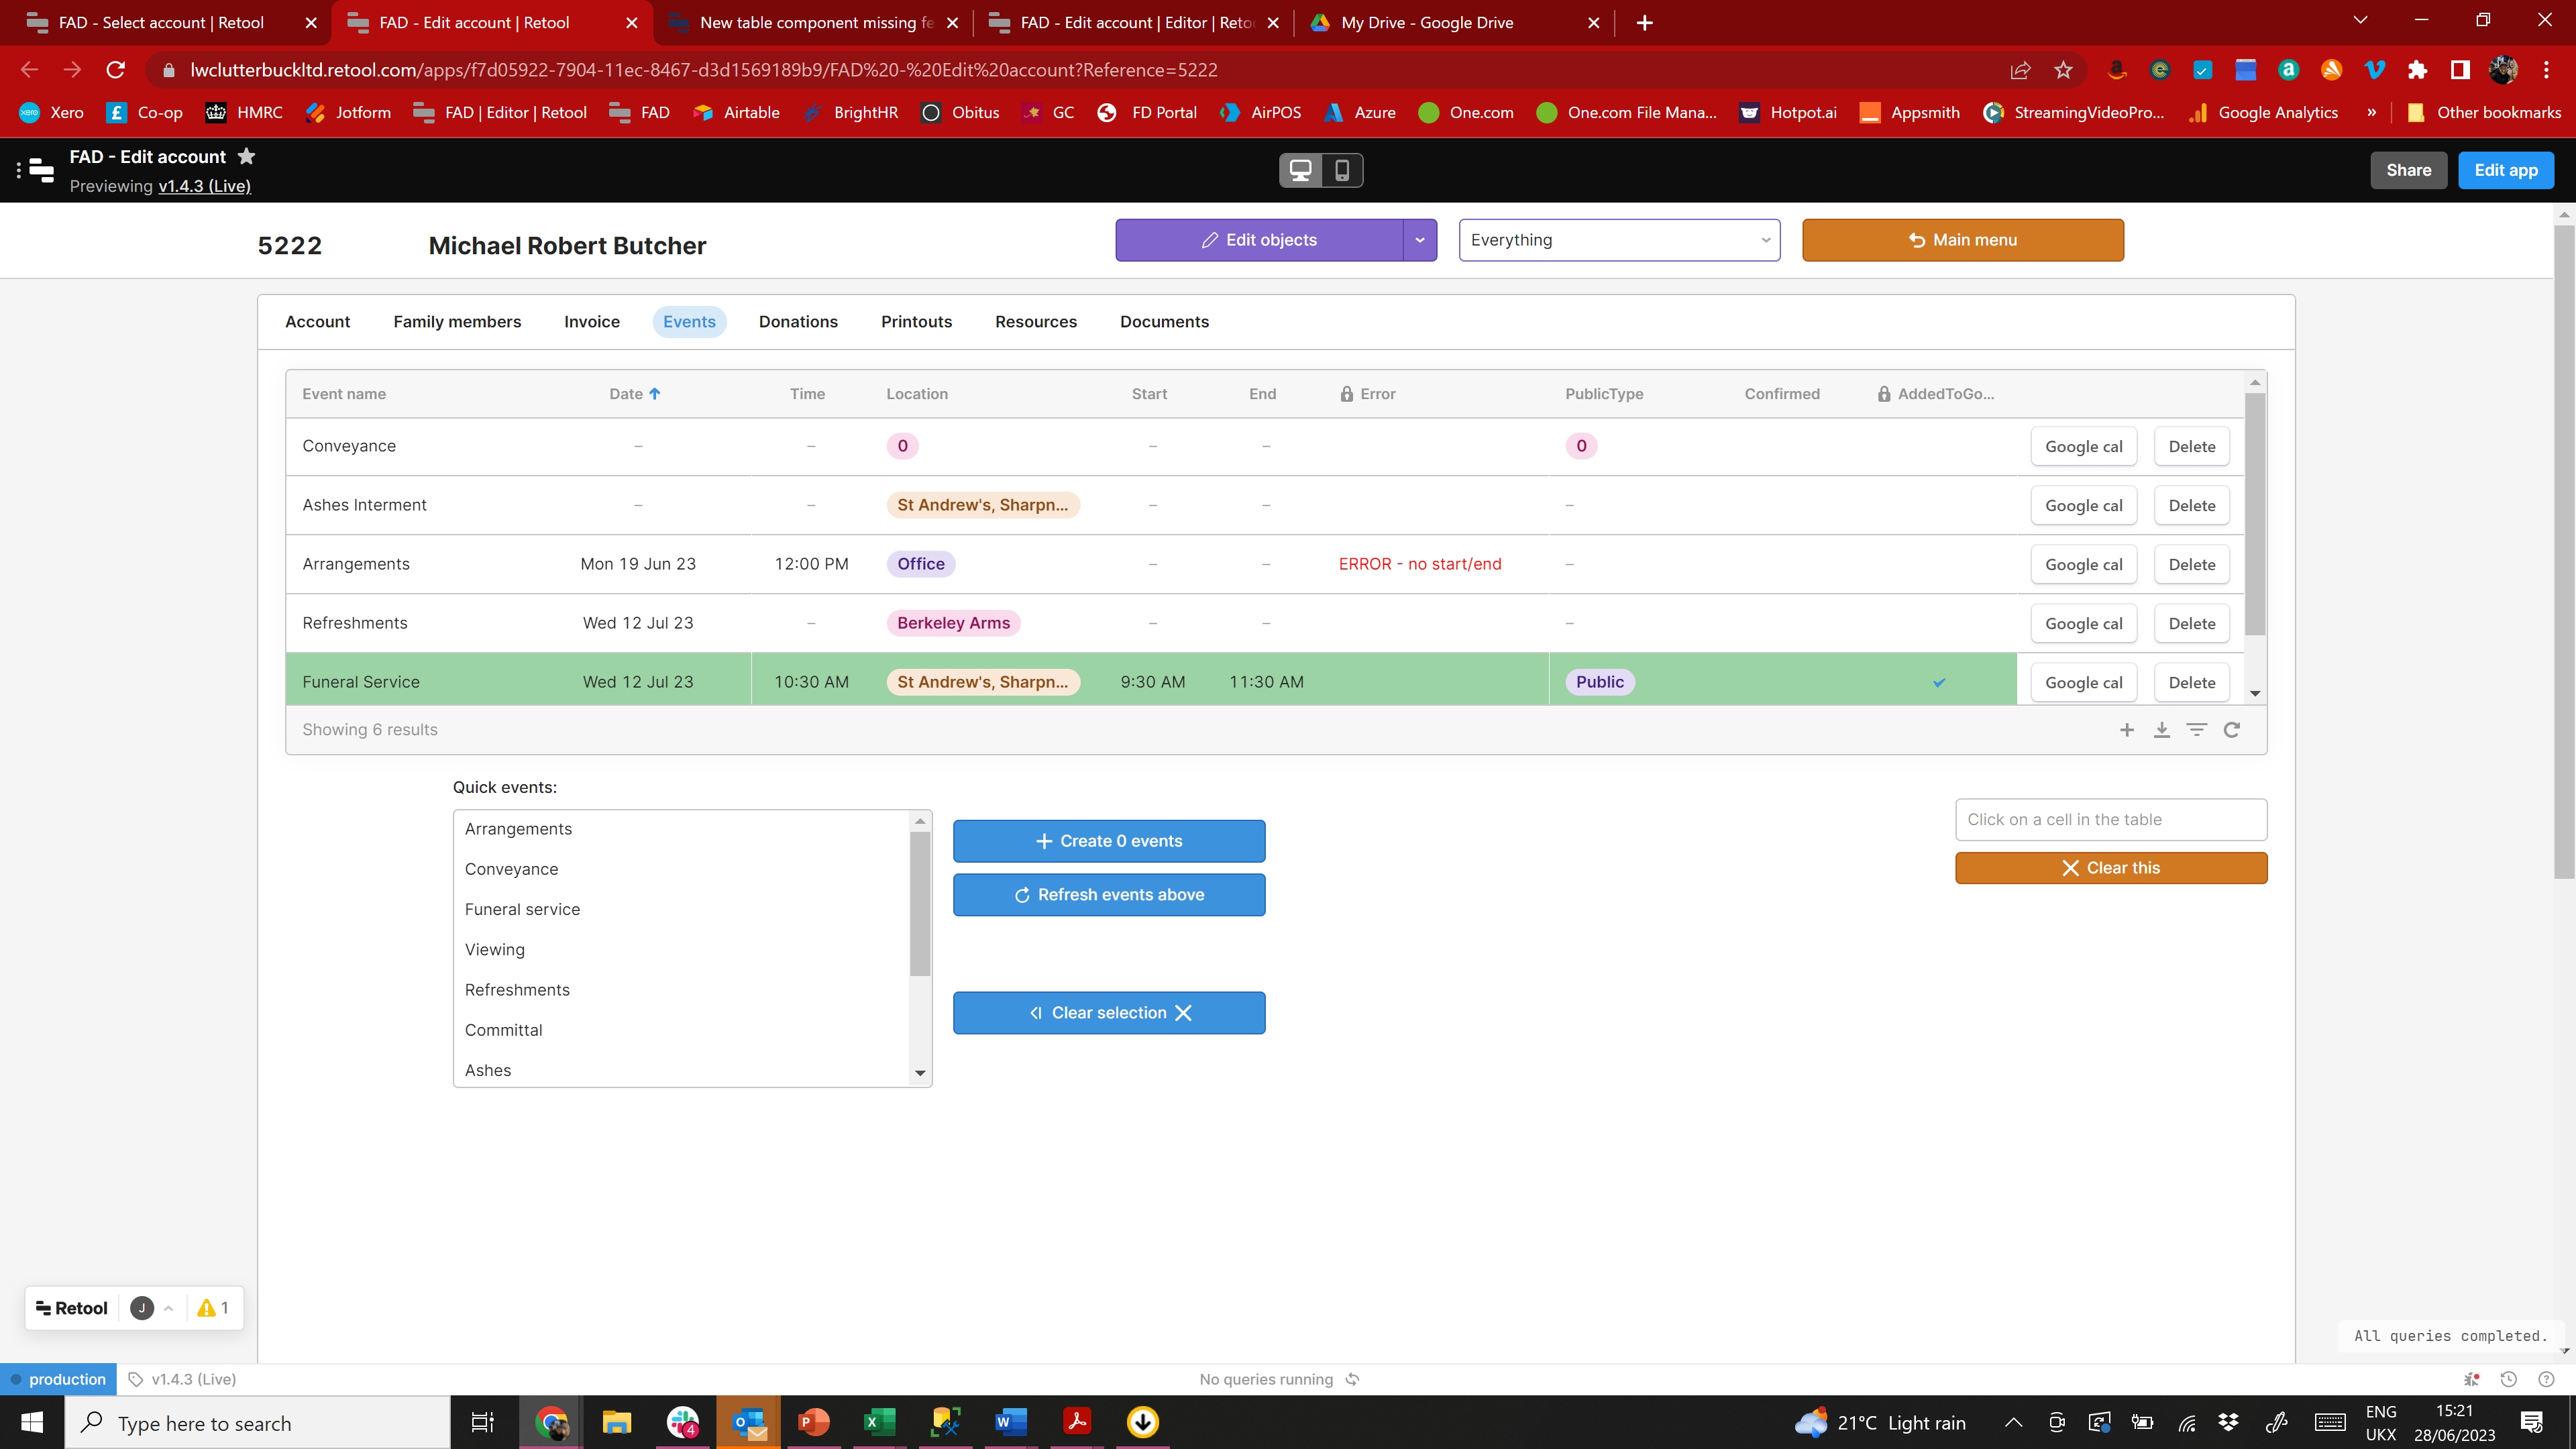
For cell edits pushed from other components, along with making edits "programmatically", I think I have found a workaround that works for me: see here My "solution" does refresh the table but from memory so supposedly fast. Net changes are still pushed down to db but with delay.
Will report back (in the other thread) if satisfactory.
Note, the latter solution does require single-cell solution to be on as it relies on selectedCell to get the row index and columnId. Hence it's catch-22: single-click possible but to a greater loss of functionality. So on this one too, it would be good if the option to explicitly choose single vs. double-click editing is brought to New table.
Hi, as a power retool user for 2 years now, I was really excited to now that the table component was redesigned from scratch.
The problem now is, the new table component really lacks some flexibility the old one had and I'll list them:
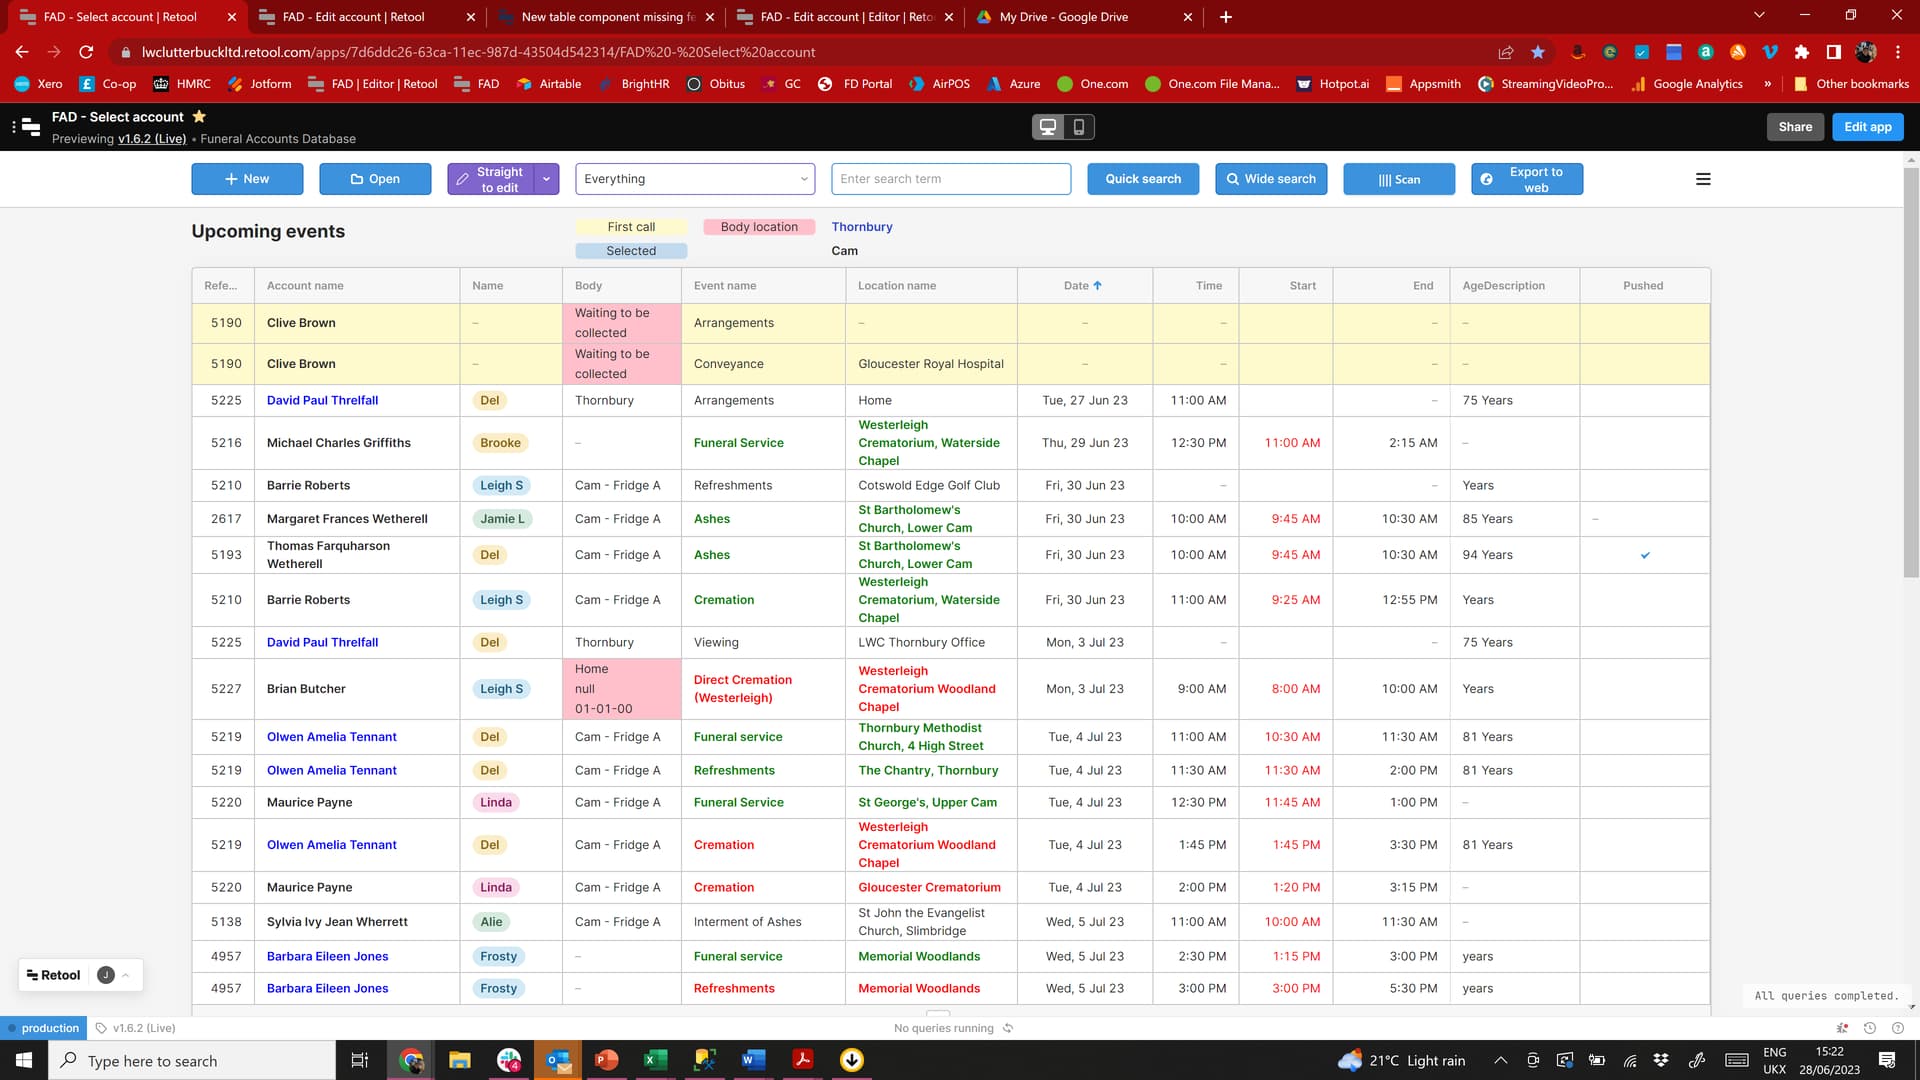
The ability to set the background color conditionally, this is something we use a lot to get the attention of the user when a value is out of our standards for example. This also allows us to have a easy visual queue of everything.
Want to jump on this. I was excited to try out the new table, but 2 main things keep me from using it.
As others have said, coloring cells dynamically is essential for our use case. Highlighting when profit is positive vs negative is really really important with lots of data.
Other thing is dynamically setting the column order and visibility with an array. This is also essential as every user wants different columns to show up in different orders. The legacy table has this in Advanced Settings and Column Settings. Along this note, I also don't see where to sort column by a dynamic column. With the legacy table I could do this with a js query, which is useful.
I'm really excited to be able to use this as it seems faster and has more options, but until these features are added I just can't.
Want add a +1 to bring back conditional background coloring. My use case is I am summing groups of rows and having the summed row be a different color really helps the UX.
I recently noticed that there is a "group" rows facility in the new table. Which feels like it has potential, but it would be awesome (?) if we could add summary info to the group header rows? Like the sum, or max/min or some other JS? Not sure if what I'm asking/suggesting is possible/easy/hard or of interest to anyone else.
Coloring is being considered, the dev team is particularly interested if there are any other features they could include that would fit the same use cases in an attempt to prioritize features that enable more accessible design patterns. So, the more information they can hear about your use case the better! Especially, if you've considered other patterns, which of those might not be available in Retool, and why you're choosing color-coding in particular.
I use a mixture of colour coding and types of columns to what best suits the situation.
I have considered using tag columns but this can take up valuable table width if it can be reasonably represented by a simple row colour! There's also a visual element of scanning left and right with your eyes. I also have changed the colour of the text, by row, according to the data using the HTML type, but is it right that I cannot edit the data in cell with that type?
I've also always wanted to change the border colour of a cell according to the data. This is a really cool functionality of Excel conditional formatting (although not Google sheets )
It's would also be useful to be able to change the colour of the text while keeping the data type, e.g. time or date columns (which have other features) but still be able to change the colour of the text (dynamically) and not have to use HTML.
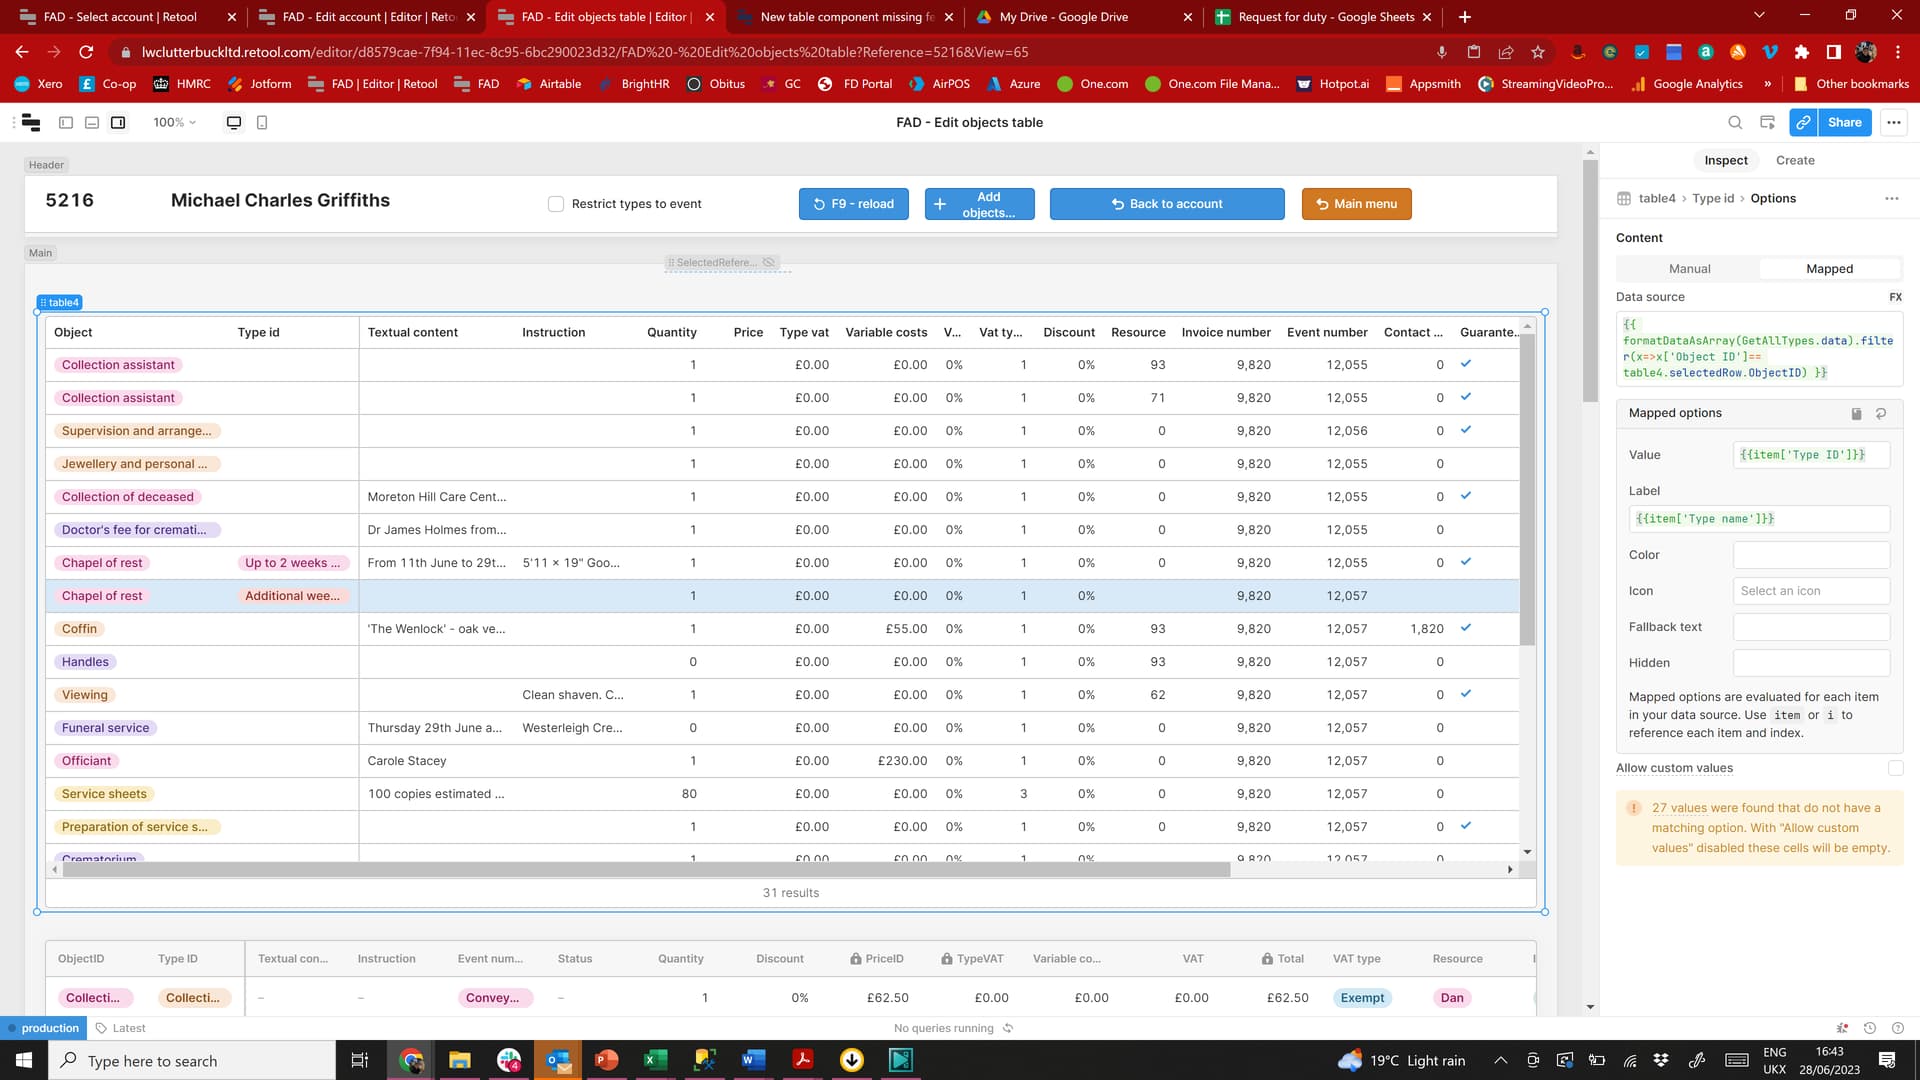
I have just tried this and now it is obvious why it doesn't work for this situation: For my use case we have Objects (a product or service), and each Object has a Type. I filter the entire array of types according to which Object it is. However, using selectedRow only the data in the selectedRow appears (or other rows which are the same object).
Today I've been playing with the new table component and I noticed that with server-side cursor pagination you can't set the "Total row count" anymore. Our cursor pagination based responses contain a total that we'd like to show in the table. The legacy table component does have this option but the new table component doesn't have this anymore it seems.
Came to here to ask the same question as @arjan. Kinda stuck not being able to move pages and dynamically update my API query.
Background
API call returns data for table, but also in headers includes info for total records and total pages. In the old table, I'd be able to input this data for server-side pagination, but can't seem to find a way to do it in the new table.
Just want to cross-post this thread that has a lot of the most recently released features for the new table in case anybody here has missed it. Of particular note is the new status indicator add-on!
Adding the total row count for cursor based pagination is also something that's being explored @arjan and @vinnie, thanks for the feedback here
It sounds like you may be having more extensive issues than just display the row count @vinnie, am I understanding correctly that you aren't able to paginate at all with cursor based pagination? Would you be up for discussing the issue more in-depth in a dedicated thread?
I've got it working. My API can accept the URL parameter "page" where value = {{usersTable.selectedPageIndex+1}}. But I miss being able to display in the table toolbar how many total records/pages exist.
Would utilizing a page change event handler to run the query also be an effective or better way of doing this? I tried that, but changing the page does nothing but increment the page number in the table toolbar, but the cells' content stay the same.
It is a more than a bit paternalistic to tell us how we should develop our apps and what UI and UX is appropriate for our users and clients.
It is a the dark pattern version of equity - knocking everyone down to the lowest common denominator vs raising up those that need it: Let's make it definitely harder for most of our users to use the app so a few might find it easier.
Give us the tools, make them flexible and powerful, then let us take on the responsibility to use them correctly. Oh, some absolute monstrosities will be created! But much brilliance will also be born. Both of those are on us.
I’d also be more amenable to this line of thinking had dynamic background colours not been an option in the first place with the legacy table.
On the point of accessibility, I seem to remember that text colour inverted for dark backgrounds automatically in the legacy table, but I might be mistaken.
The status indicator is great for discrete datapoints, but it would be nice to see continuously variable cell background gradients to create heatmaps within tables (including colourblind-friendly options, naturally)
@bradlymathews@ryanm Thanks for your feedback -- tons of great points! We want Retool to be maximally flexible and powerful, but also have great defaults that nudge users to the right patterns. That heatmaps use case is a great one, and similar to other customers we've spoken with this week. Please do let us know if there are any other features for Table that you feel like are missing / fall into this pattern.
We'll plan to add background color support to the new Table soon, similar to how it was configured on the legacy table.