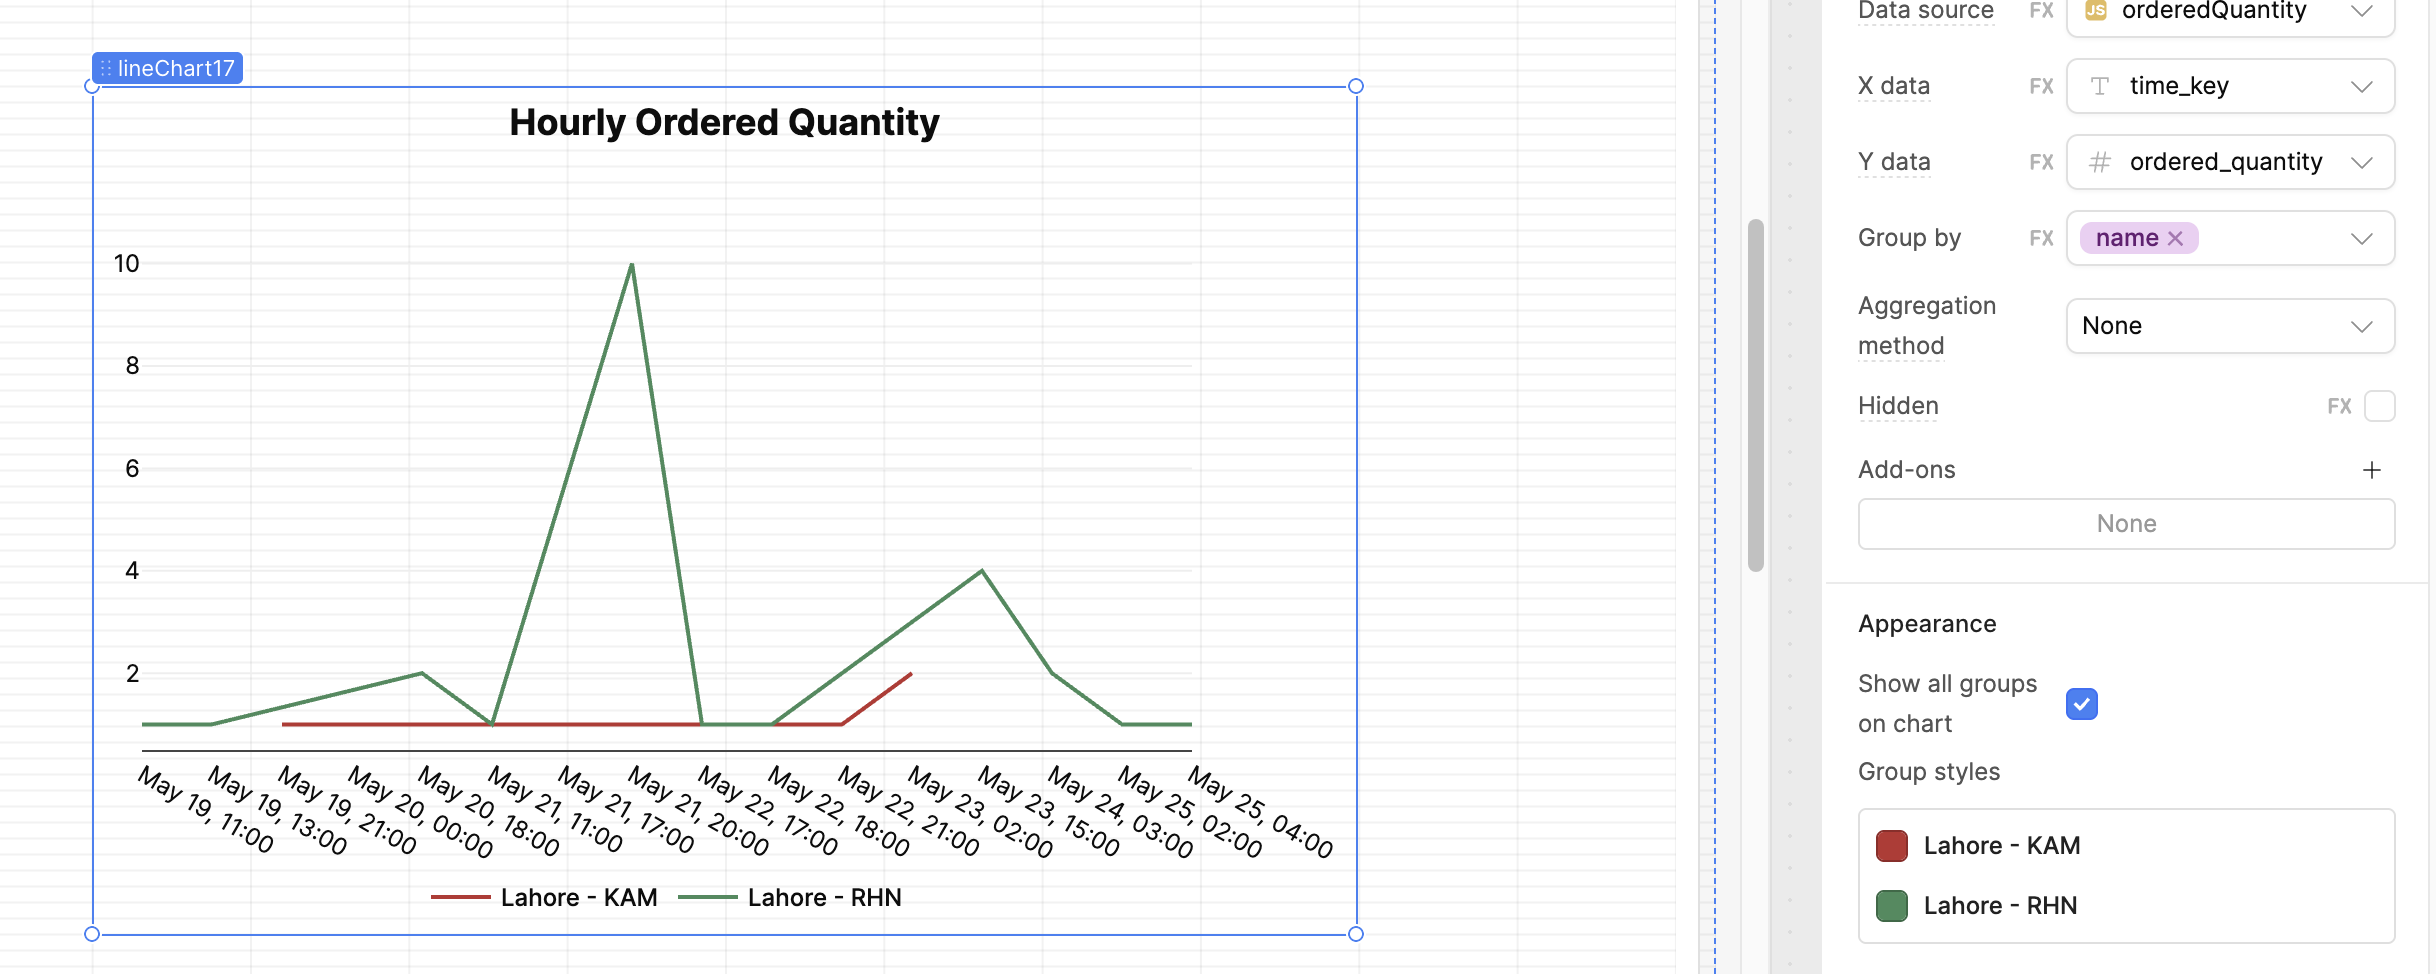
Team, I want to display hourly data (the labels should show me date, hour : quantity). However, I want the x-axis to still show me dates. Can you kindly how can I achieve this on new charts?
Hey @engineering-tajir,
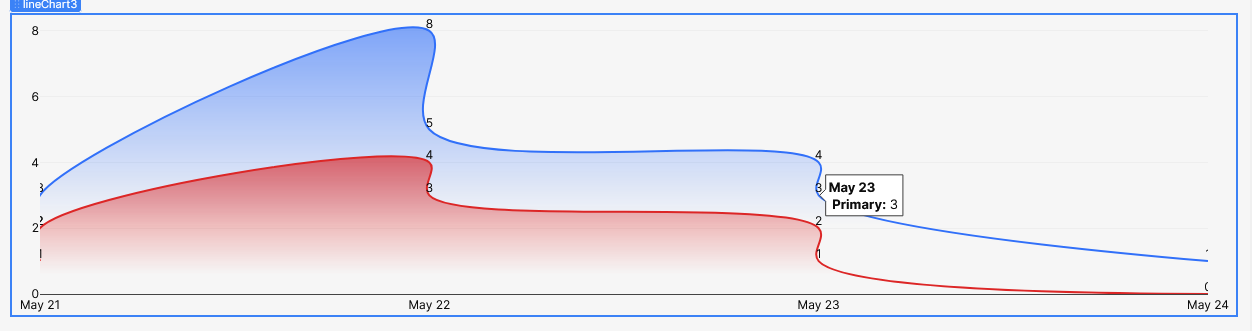
If you want the x-axis to display only the dates (e.g., May 23, May 24) but show a detailed tooltip on hover like:
May 23, 14:00 → Quantity: 5
You can achieve this in two steps:
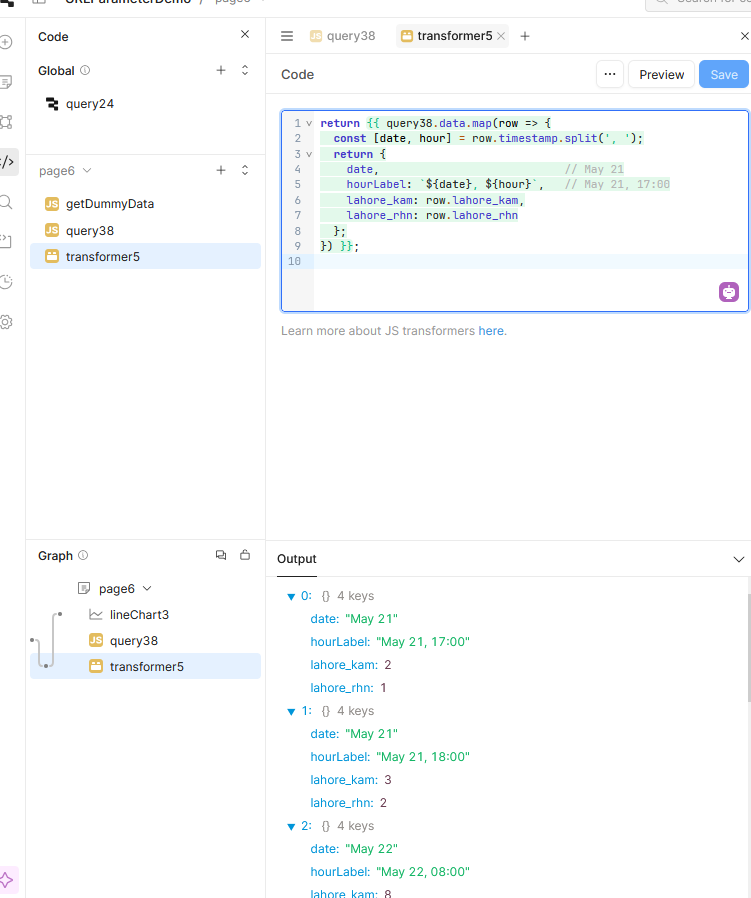
Data Transformer (for x-axis values)
Use a transformer to separate the date and hour from your timestamp, so the x-axis only shows the date, while the full timestamp remains available for tooltips.
Here’s a sample transformer code:
return {{ query38.data.map(row => {
  const [date, hour] = row.timestamp.split(', ');
  return {
    date,                            // May 21
    hourLabel: `${date}, ${hour}`,   // May 21, 17:00
    lahore_kam: row.lahore_kam,
    lahore_rhn: row.lahore_rhn
  };
}) }};
This will:
![]() Set
Set date as the x-axis value
![]() Keep
Keep hourLabel available for use in the tooltip
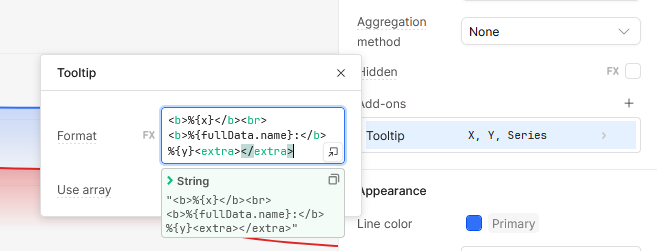
Customizing the Tooltip (hover labels)
In your chart settings, go to:
![]() Add-ons → Tooltip
Add-ons → Tooltip
Use a custom template or formatter like:
<b>%{x}</b><br>
<b>%{fullData.name}:</b> %{y}<extra></extra>
This will display:
- The full time (from
hourLabel) - The series name (
lahore_kamorlahore_rhn) - The value (
y)
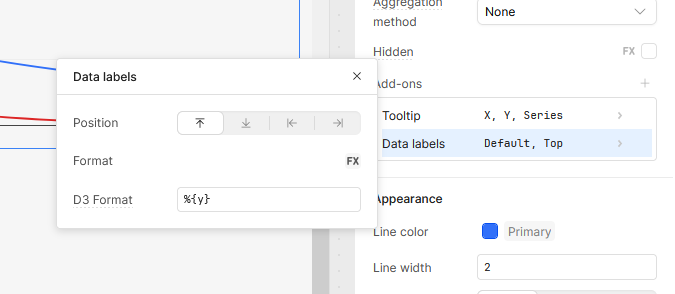
Alternative: Data Labels on the Chart
If you want to display the value directly on the chart instead of in a hover tooltip, go to:
![]() Add-ons → Data Labels
Add-ons → Data Labels
There, you can configure what’s shown on top of each point/bar.
1 Like
@WidleStudioLLP thanks for the detailed guidance. The first solution works for me.
1 Like
Thank you for your response — happy to work on the X-axis label!
1 Like