Hi, everyone! I have searched around the forums and found similar topics, but no solution worked for me. It's also maybe because the Chart component I'm using isn't that complicated, at first. But maybe because I'm a rookie on this, I can't solve this issue.
My goal:
I want to show the proper timezone or date in the Chart. It lags a day behind.
Issue: The X-axis label in chart lags a day behind from the actual data source.
I have a GSheet as a source of data. The data then queried using SQL to get basically summary of several things including Weekly Results. The result is all is well and shows the correct date formats. It's also ISO-formatted in my JS queries, changing from the value MM/DD/YYYY to the proper format of YYYY-MM-DD.
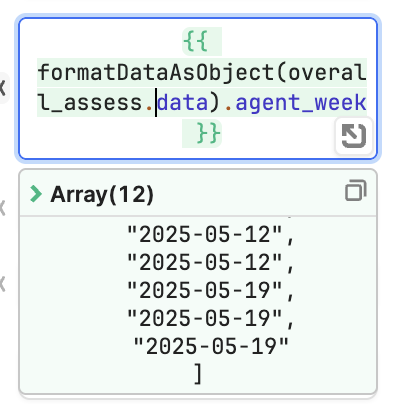
However, when building charts, the X-axis label shows 1 day behind from the actual data. I directly uses the Chart's data picker/dropdown instead of setting it dynamically using the {{ }}. Just for your reference maybe, if I click the dynamic value, it shows {{ formatDataAsObject(overall_assess.data).agent_week }}. It returns array of 12, with correct dates such as 2025-05-19. But my chart still shows May 18 instead.
Steps I've taken to troubleshoot:
I tried using JS queries to transform the data also try to set it to ISO format, change timezone. But the Chart still shows different date from the actual data it refers to.
Additional info:
As you can see, the data source is different from the chart shows above. I can't find a way to even change timezone for the Charts.
EDIT: I was playing around the chart. If I uses other type of bar charts, like Group, and then drag it wider, like simply drag it so wide, it shows proper label and date. However, if I return to stack, it shows unnecessary labels and somehow the bar graph stuck in between of May 17 - May 20. Is this an error in label or on how I set it up? Anyway, to actually makes more precise labels?
If hovering over the data, it actually shows correct value and data.
Apologies for the confusion on this issue. It sounds like you are using the charts and the data source correctly.
Could you share a JSON export of your app with query data so that I can test it out and play around with it to see what could be the reason for this wrong by one date display.
From your second comment, it sounds like the issue may be that at a certain size the component hides the correct date which is still visible when you hover over the bar
This makes me think this is likely an issue with how the component shrinks and incorrectly scales/groups things together.
Once I get a JSON export of the app I can test things out and let you know if I file a bug report for the re-sizing on shrink of the component. My guess is the Stack parent component is the culprit of this size compressing that leads to an incorrect display.
It sounds like the styling might be causing this issue. Where the dates are getting compressed. Since it appears correct on hover but the way the X axis groups dates it is making incorrect and unintuitive 'jumps'.
I can file a bug report for this!
If you have a demo app you can share for me to reproduce this or a some source data as a payload I could use to test this, that would be super helpful!