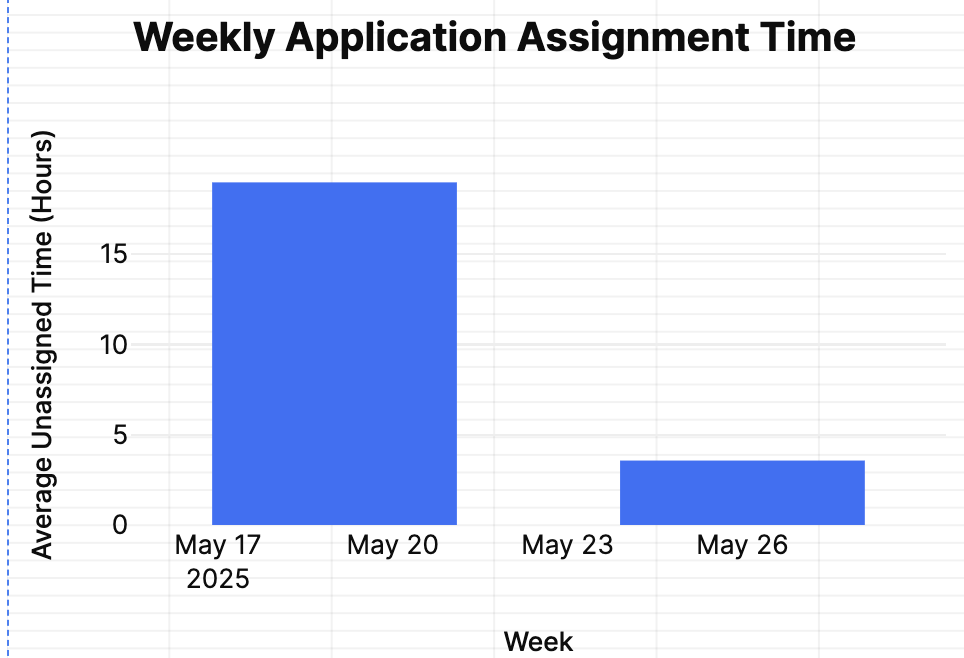
Hi - is anyone able to help with the proper formatting of dates on x-axis of a bar graph?
this is weekly data and the first bar points to May 16 the second one points to May 26. How do i only make those appear on the x axis?
Hi - is anyone able to help with the proper formatting of dates on x-axis of a bar graph?
this is weekly data and the first bar points to May 16 the second one points to May 26. How do i only make those appear on the x axis?
Hello @Mahaveer_Ukrani ,
"2025-05-16" and "2025-05-26" into the bar chart's x-axis, you can format and control them like this:// In a Transformer or JavaScript Query:
return [
{
date: "2025-05-17",
weekLabel: "May 17",
avgUnassignedTime: 18
},
{
date: "2025-05-26",
weekLabel: "May 26",
avgUnassignedTime: 4
}
]
.map(row => ({
...row,
weekLabel: new Date(row.date).toLocaleDateString("en-US", {
month: "short",
day: "numeric"
})
}));
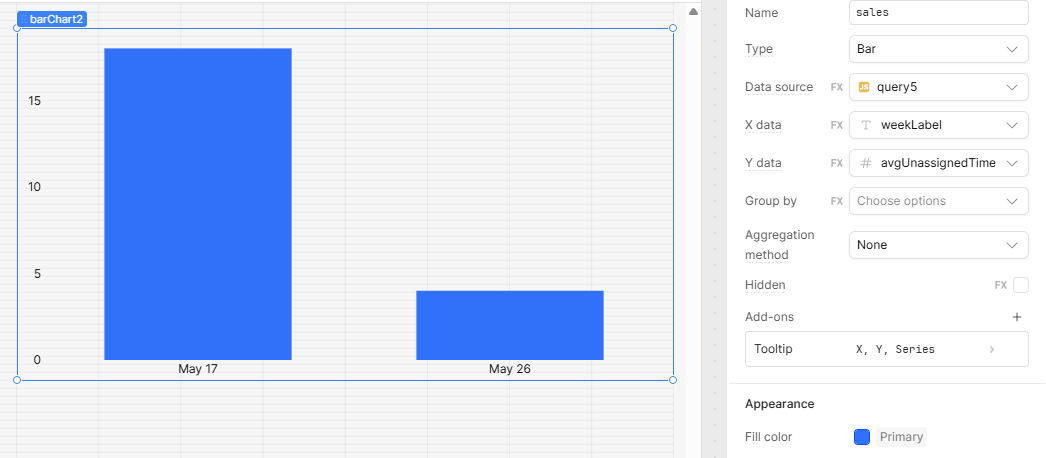
In your Bar Chart settings:
weekLabelavgUnassignedTime)