-
Goal: I want to show flexible data in a linegraph.
-
Steps: I was able to configure it statically, (for each item a seperate serie), but now I want to make the Y-axis dynamic based on the dataset.
-
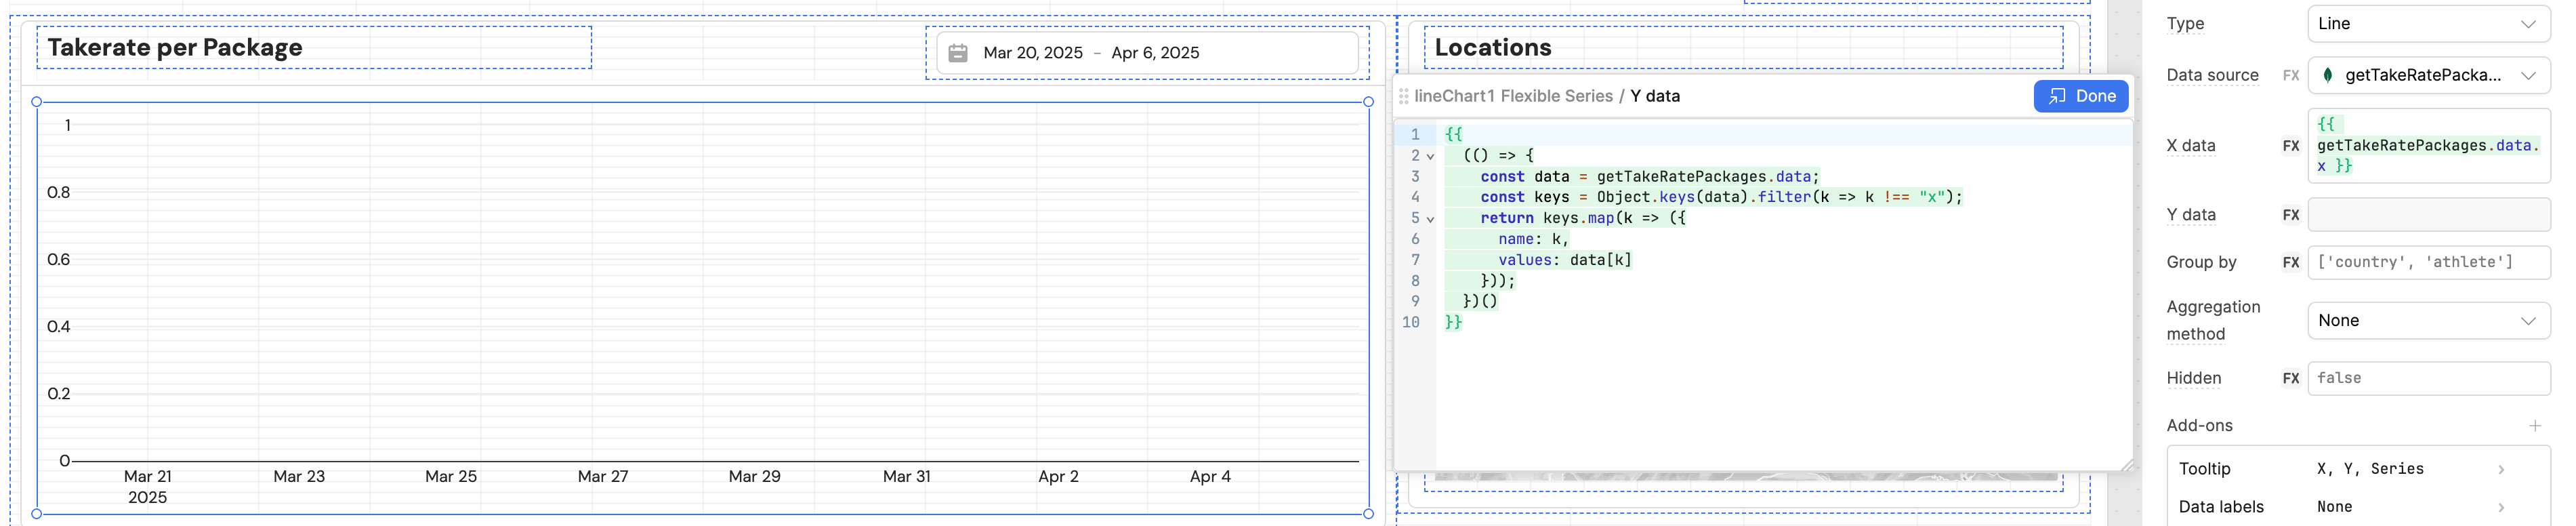
Details: Please check the screenshots on which array I get. The names of the array can vary, so therefore I would like to load them dynamically in the linechart:
Apparently this doesn't work:
{{
  (() => {
    const data = getTakeRatePackages.data;
    const keys = Object.keys(data).filter(k => k !== "x");
    return keys.map(k => ({
      name: k,
      values: data[k]
    }));
  })()
}}
Thanks so much for any help or suggestion. 
Hello @Tom_Suter ,
you can use a Transformer to make the line chart dynamic based on your dataset structure
- Create a Transformer
const data = getTakeRatePackages.data;
const xAxis = data.x;
const keys = Object.keys(data).filter(k => k !== "x");

return keys.map(k => ({
  name: k,
  type: "line",
  data: xAxis.map((xVal, idx) => ({
    x: xVal,
    y: data[k][idx]
  }))
}));
- Then in your chart component, set the Data field
{{ transformTakeRateData.value }}
5 Likes
Hi @WidleStudioLLP , thanks for your suggestion. Unfortunately it doesn't work and I don't get any output from the query anymore after the transformer.
I have this already as transformer:
const normalize = str =>
  str.normalize("NFD")
    .replace(/[\u0300-\u036f]/g, "")
    .replace(/[^a-zA-Z0-9_]/g, "_");

const processed = data.map(d => ({
  ...d,
  date: new Date(d.date)
}));

// ✅ Use scoped variables directly from Additional scope
const start = new Date({{ dateRange1.value.start }});
const end = new Date({{ dateRange1.value.end }});

// Generate all dates within the range
const allDates = [];
let current = new Date(start);
while (current <= end) {
  allDates.push(new Date(current));
  current.setDate(current.getDate() + 1);
}

const packages = [...new Set(processed.map(d => d.package))];
const result = { x: allDates };

packages.forEach(pkg => {
  const key = normalize(pkg);
  let runningTotal = 0;

  result[key] = allDates.map(date => {
    const dayStart = new Date(date);
    const dayEnd = new Date(date);
    dayEnd.setHours(23, 59, 59, 999);

    const count = processed
      .filter(d => d.package === pkg && d.date >= dayStart && d.date <= dayEnd)
      .reduce((acc, d) => acc + d.count, 0);

    runningTotal += count;
    return runningTotal;
  });
});

return result;

const xAxis = result.x;
const keys = Object.keys(result).filter(k => k !== "x");

return keys.map(k => ({
  name: k,
  type: "line",
  data: xAxis.map((xVal, idx) => ({
    x: xVal,
    y: data[k][idx]
  }))
}));
This gives me this result:
This is actually quite a nice array I think and should be fed to the lineChart component so that it dynamically creates the lines (drielander_a is one example of a line, but there are more below).
Or should I change the Transformer somehow?
1 Like
I found the solution yet. I actually had to deliver the data in a completely different format to Retool.
The example data here did the trick: