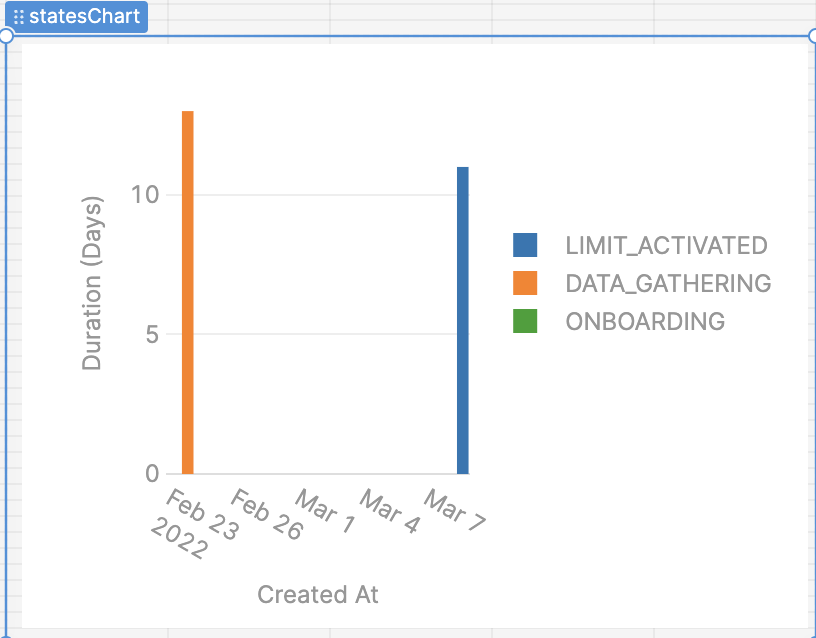
I have an old copy of a module with a Bar Chart which seems to use the default Plotly.js colors (muted blue, safety orange, cooked asparagus green, etc.)
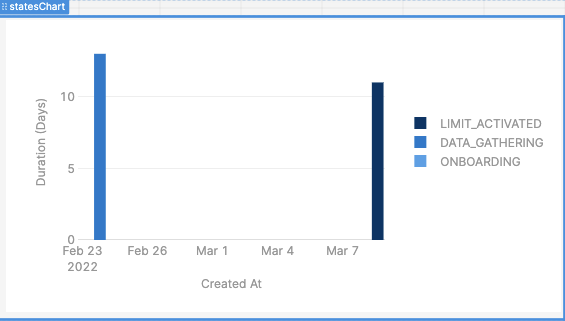
Later, whenever I created new Bar Charts, they all use a different default color scheme (blue, blue, blue, etc.)
How do I set the properties on Chart to use the default Plotly.js colors? I tried comparing the Layout > Plotly JSON of these 2 charts, but the json values are identical.