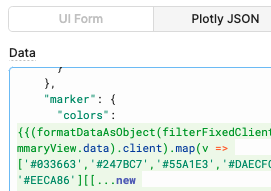
The chart component's properties can be changed manually via the Plotly JSON Data and Layout panels. Is there a way to set these properties for example the marker's color programmatically? For example, I tried triggering javascript code with
chart1.data['0'].name = "new name"
where "chart1" above is my chart component, but it had no effect on the attributes.
How does one go about changing the attributes of the chart component programmatically? Thanks.
Not yet. I have a javascript query that generates user-specific charts where the users are specified through a multiselect. The problem lies in specifying how the charts are to be rendered. If I wish to tweak the x-asis ticklabels or change the name or the color of a chart, then it appears I have to go to the UI Form and Plotly JSON panels and directly tweak them. Sure, I can insert some code in these panels (as ScottR indicated) but what I really want is to avoid using these panels if possible and do it via the script itself. The Retool-Plotly linkup isn't very clear to me even after reading everything I can find on it. For example, can I have a script output a Plotly JSON file and have Retool generate the charts as per that file? All the examples I've seen are about generating data arrays with the tacit understanding that any changes to the appearance of the charts have to be done via the panels, post-generation, and not during chart generation itself. Doubtless, these are newbie misunderstandings. Thanks for following up on my query.
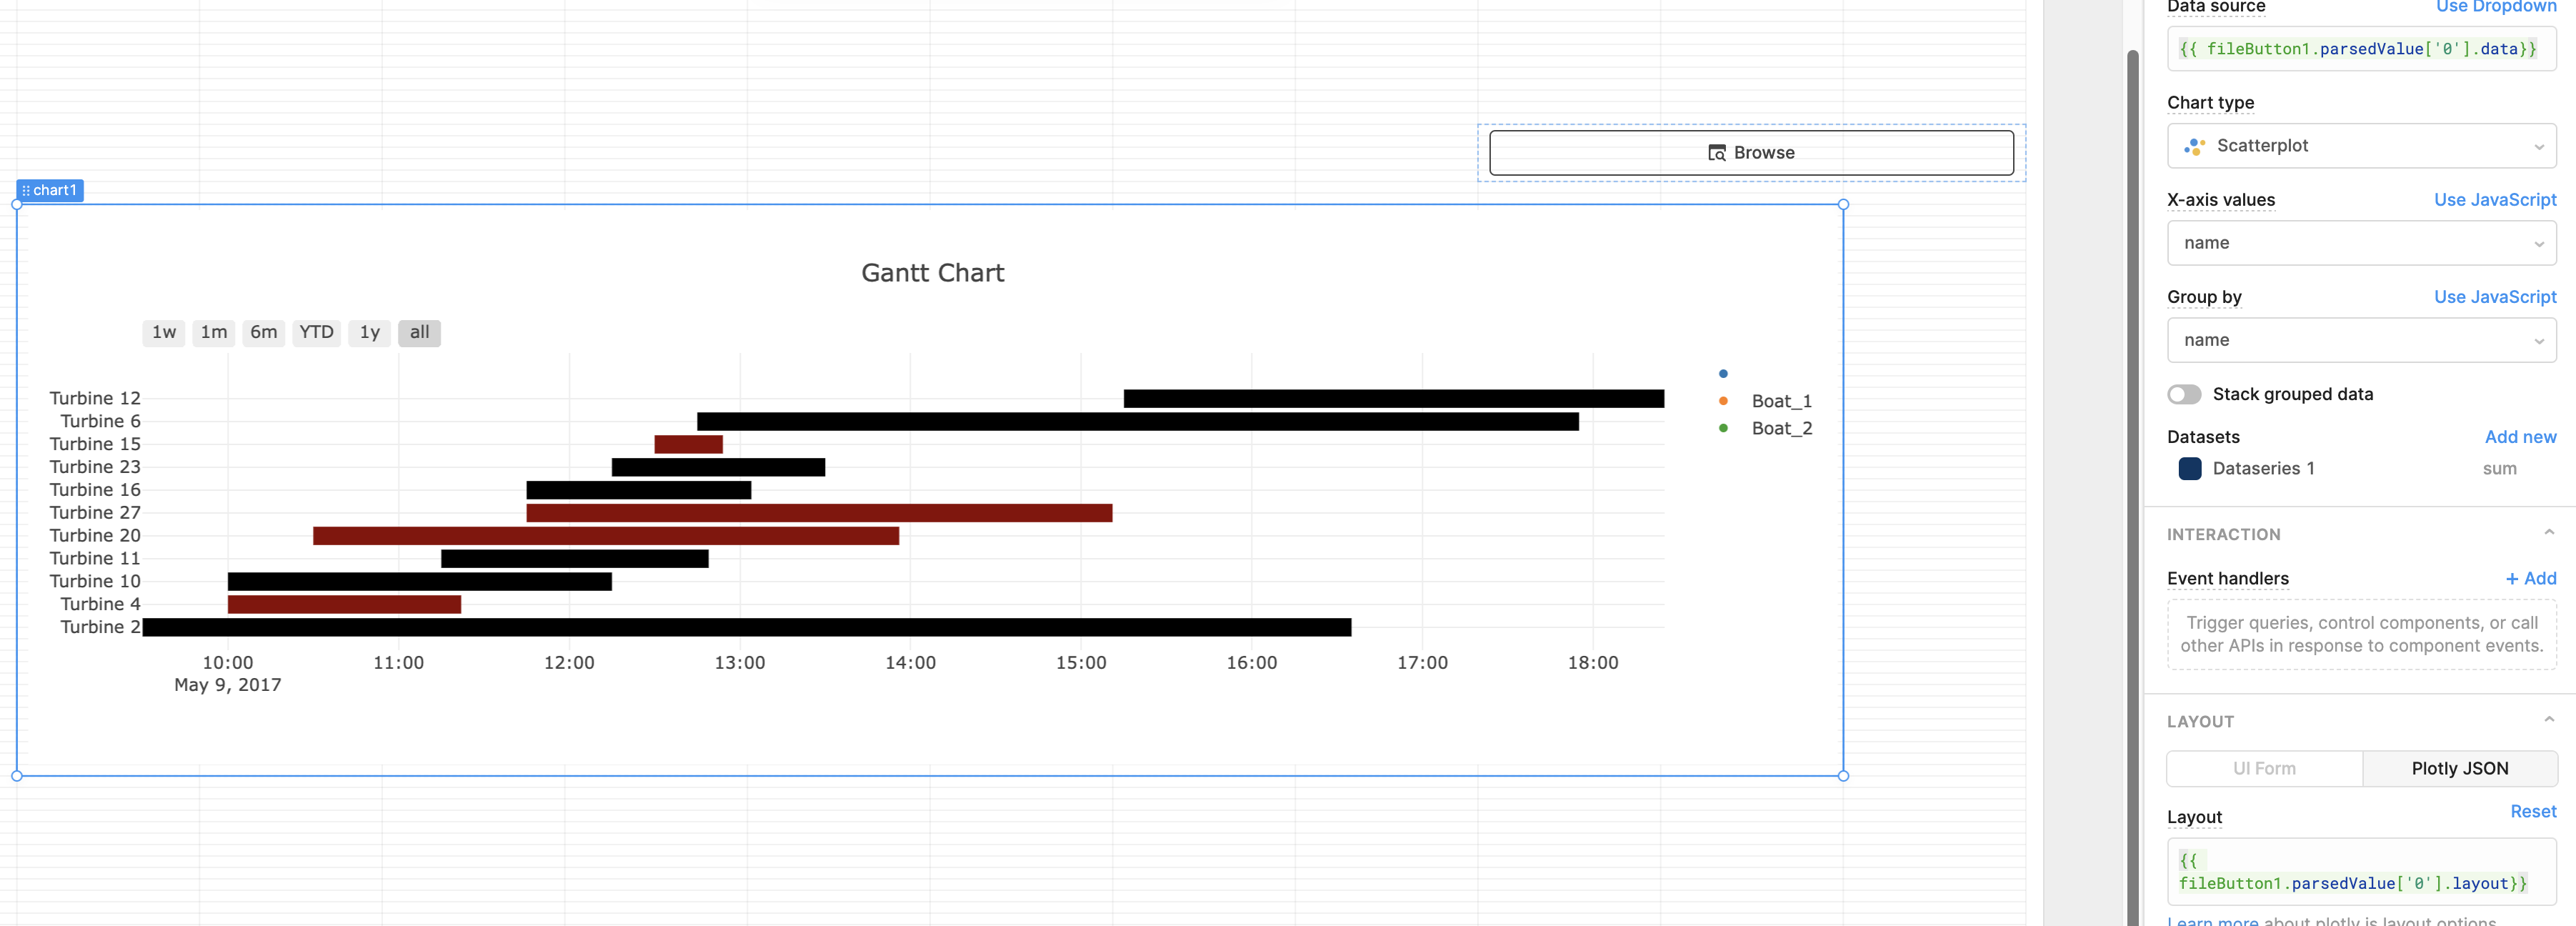
@anilm411 thanks for breaking down your use case further! Yes, you can definitely have a script output a Plotly JSON file and populate the chart in Retool -- here is a quick example where I uploaded that file type in app and populated a chart with it:
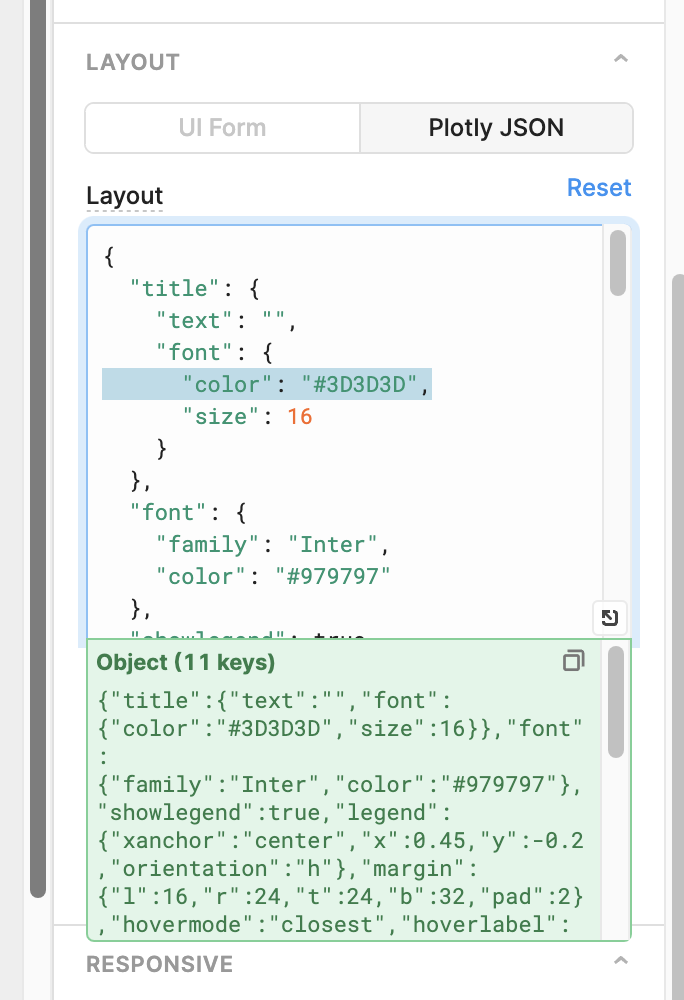
How are you currently generating this chart? Here is an example I believe could be similar to your setup where I change the layout dynamically using a JSON editor component: