We’ve added two new tabs, State and Timeline, that enable you to inspect the app state, drill into dependencies, and visualize query runs.
The State tab allows you to view the current state of all properties in your apps, as well as see dependencies between individual properties and calls from event handlers or JavaScript. This makes it easy to see everything that triggers a specific query. You can also directly jump to what you need with a “View state” context menu action and built-in search.
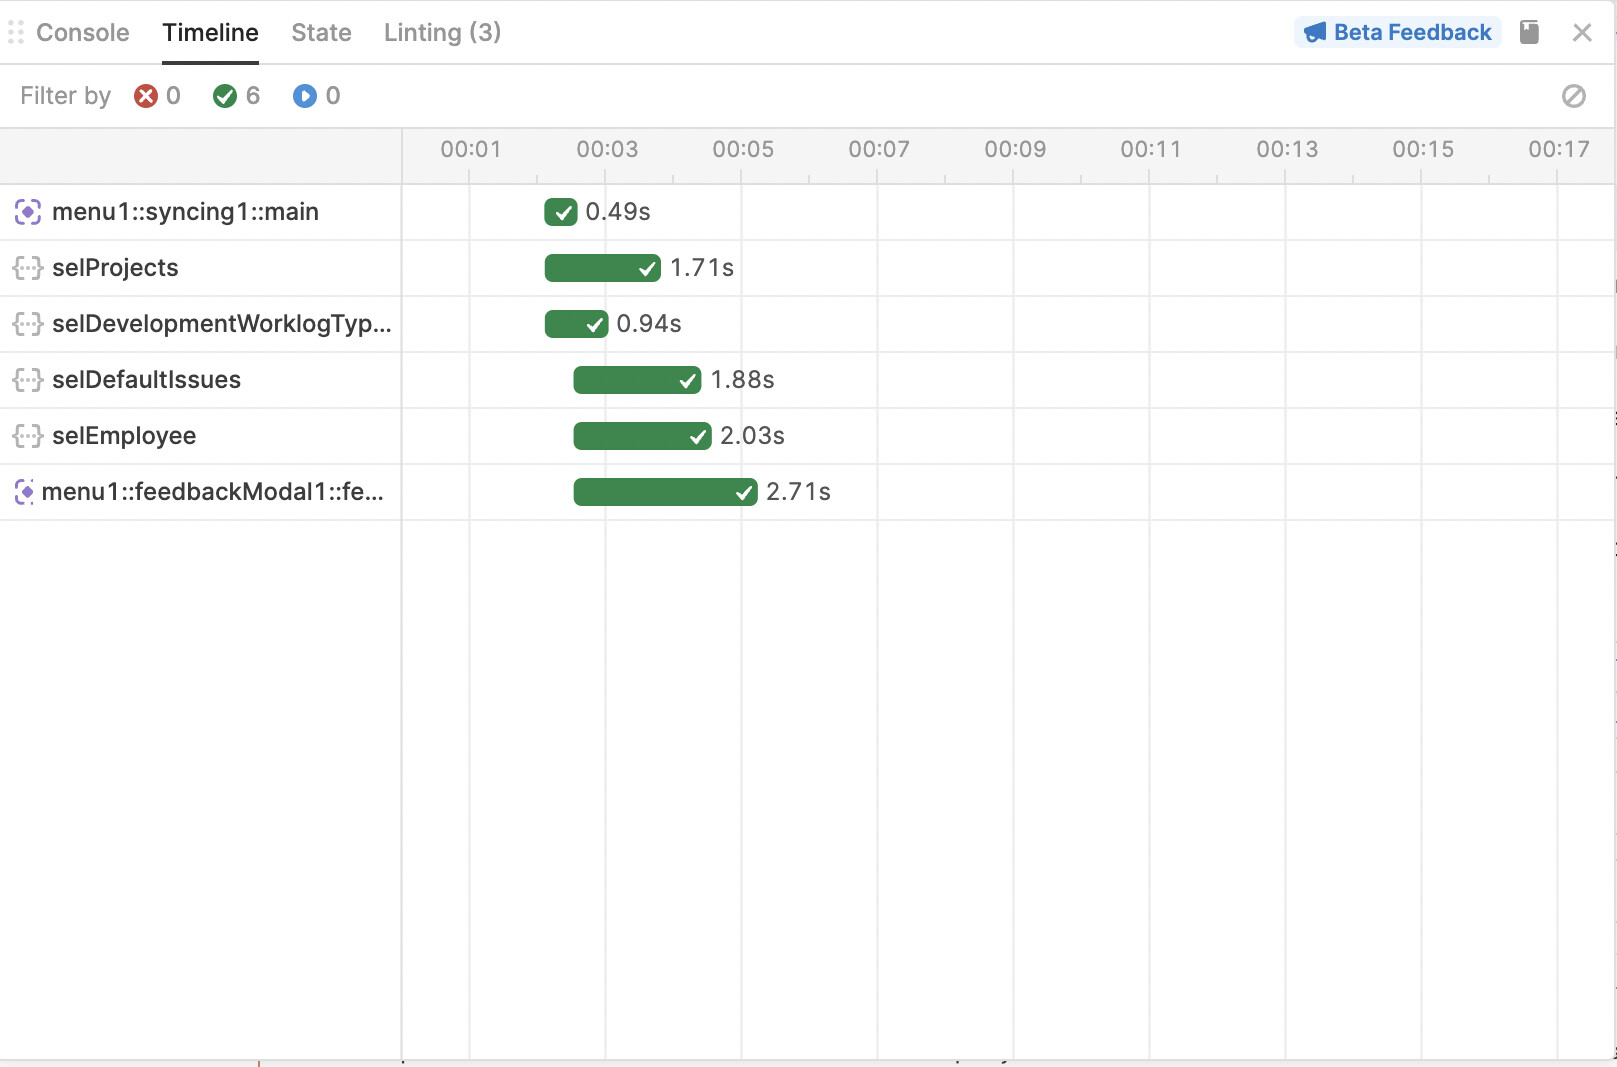
The Timeline tab shows a live view of all query runs, making it easier to visualize run times, compare sequencing, and quickly identify successful, failed, and active query runs.
We've also moved Environments, Releases, and History to the status bar for easier access. The status bar is only visible to users with edit permissions.
To access the Debug Tools beta, navigate to the Beta tab in your organization’s settings and turn on the Debug console and status bar toggle. Share your feedback with us by clicking on the Beta Feedback button in the top right corner! These updates are currently live on cloud and will be available on-prem in v2.98.