Overview
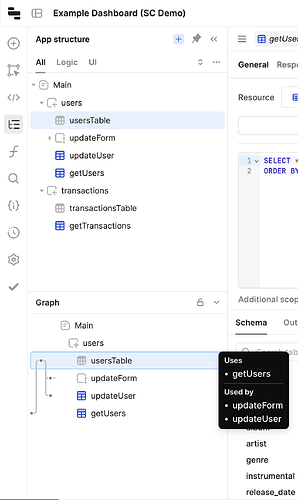
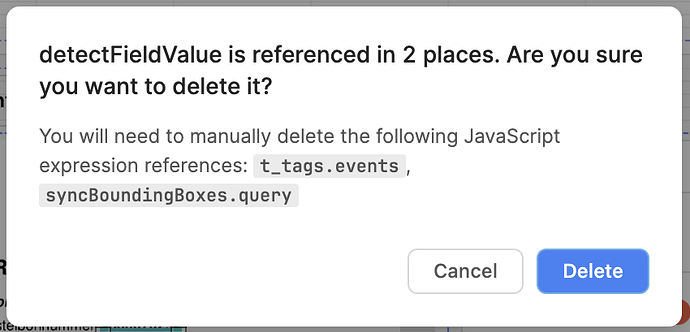
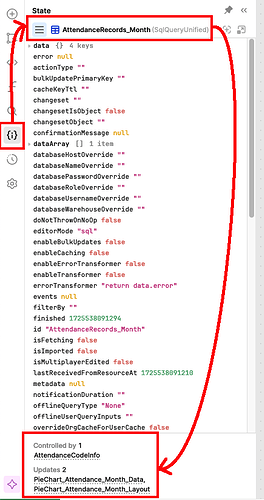
We’re experimenting with a new tab in the left sidebar that offers a new view of your application, drawing edges between nodes to demonstrate how they are connected via data flow + control flow.
Motivation
Tracing and debugging logic in Retool apps is really difficult at scale, which in turn makes collaborating and building additional features difficult as well.
We believe that debugging existing apps + understanding logic flow will be easier if users can visualize the underlying dependency graph that powers a Retool application.
Want to try it out?
If you use Retool to build complex apps, and you think this feature can help you better understand how those apps work, we'd love to chat! Please fill out this form to get on the list for early access.


