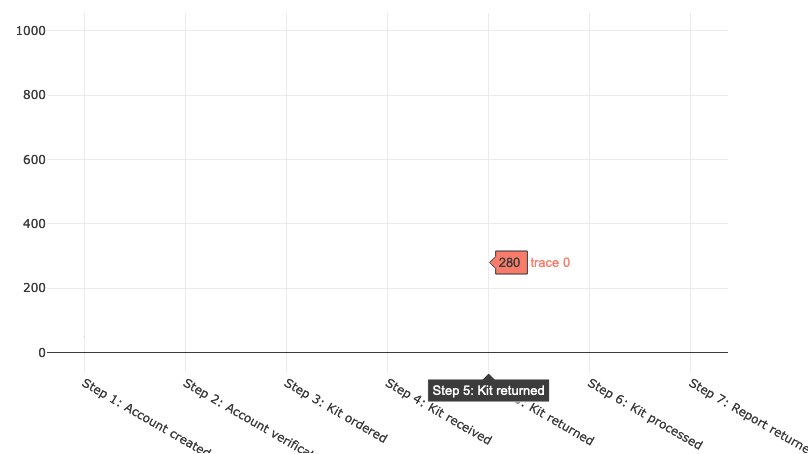
Hello! First post on the forums. I'm having a real struggle setting the marker size in a scatter plot to an array of values. My end goal is to set the marker size using the values from an object that I've assembled via a JS query, converted to an array. However, I've found that even using a hardcoded array of values like that seen in this documentation causes only one of my seven data points to appear.
I have the same Plotly JSON content applied to my chart component in both the "Data" and "Layout" fields. Here is my problem JSON:
[
  {
    "type":"scatter",
    "mode":"markers",
    "x":{{formatDataAsObject(Table.displayedData).processStep.sort()}},
    "y": {{Table.displayedData.id}},
    "transforms": [
  	{
      "type": "aggregate",
      "groups" : {{formatDataAsObject(Table.displayedData).processStep.sort()}},
      	"aggregations": [
      	{
      		"target": "y",
      		"func": "count",
       		"enabled": true
     		}
      	]
      }
    ],
    "marker":
    {
      "size":[10, 30, 40, 10, 80, 25, 67],
      "color": "#fa8775"
  	},
  },
{
	"xaxis": {
  	 "title": {
       "text": "Test X Axis",
       "font": {
         "family": 'Montserrat',
         "size": 12,
         "color": "#34353f"
       }
   	 },
  	},
  	"yaxis": {
   		"title": {
     		"text": "Test Y Axis",
      	"font": {
       		"family": 'Montserrat',
       		"size": 12,
        	"color": "#34353f"
      	}
    	}
  	}
  }
]
When I try to use my generated array instead of the hardcoded one above, the value for the "size" attribute is {{Object.values(aggregateProcessStepPopulations.data.ALLTIME_POPS.percentages).map(Number)}}
Any ideas for getting my markers to size based on an array of values? Is this supported in Retool?
An additional note, even though my points do not display I am still able to see tooltips when hovering over each data point. I noticed that when I simply set the size to 0 or null, the points all display at the default size.
Hey @EmBright!
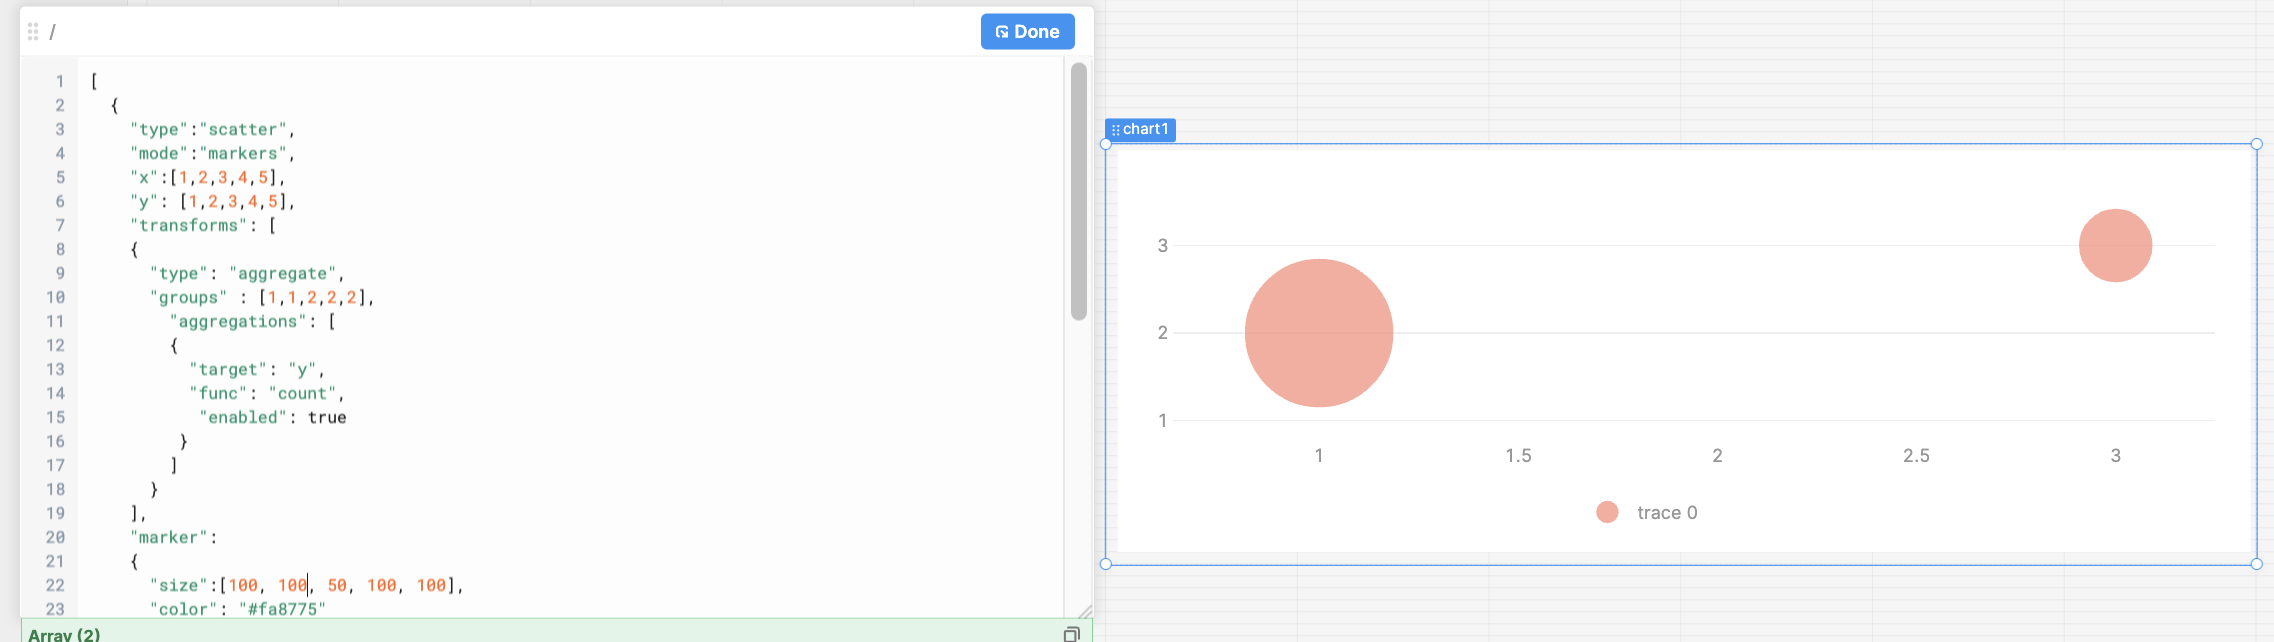
Playing around with this a bit and it looks like when you set the size to be an array as you have, it gets correlated to your data before that data is aggregated. Once the aggregate happens plotly uses the first member of each group to determine the size.
Is the size meant to correspond with each process step independent of its count or should it grow as the count does?
Thanks for jumping in to help! I need to size the markers based on a separate metric I've calculated in a JS query that runs a couple functions and returns an object of objects, which I'm currently trying to reference as {{Object.values(aggregateProcessStepPopulations.data.ALLTIME_POPS.percentages).map(Number)}}.
I see, what if you aggregated your data before passing it to plotly? Since you're using count maybe something like _.countBy could work.
Say you wrote a separate aggregatedData transformer that does something like:
const data = {{formatDataAsObject(Table.displayedData).processStep.sort()}};
return _.countBy(data);
then had your JSON be:
[
  {
    type: "scatter",
    mode: "markers",
    x: {{Object.keys(aggregatedData.value)}},
    y: {{Object.values(aggregatedData.value)}},
    marker: {
      size: {{Object.values(aggregateProcessStepPopulations.data.ALLTIME_POPS.percentages).map(Number)}},
      color: "#fa8775",
    },
  },
  ...
]
What do you think?
1 Like
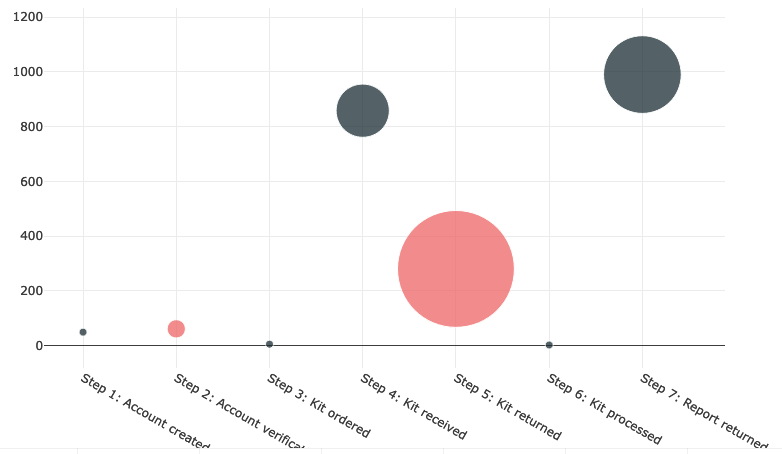
This solution worked perfectly! Thanks for the helpful explanation about Plotly's behavior with aggregate transformations, your example was very helpful. For my solution, I created a transformer as you suggested to pass the aggregated data to use for marker placement called countDisplayedProcessStepPop as follows...
const data = {{formatDataAsObject(Table.displayedData).processStep.sort()}};
return _.countBy(data);
Then I adjusted my JSON to use this transformer. One I saw this working, I also added logic to my aggregation function (a JS query) to pass an array of hexcodes to color markers in addition to the array of metrics used to size the markers. My JSON ended up looking like this:
[
  {
    "type":"scatter",
    "mode":"markers",
    "x":{{Object.keys(countDisplayedProcessStepPop.value)}},
    "y": {{Object.values(countDisplayedProcessStepPop.value)}},
    "marker":
    {
      "size":{{Object.values(aggregateProcessStepPopulations.data.ALLTIME_TO_THIRTYDAYS_POP_DIFFS)[0].map(Number)}},
      "color": {{Object.values(aggregateProcessStepPopulations.data.ALLTIME_TO_THIRTYDAYS_POP_DIFFS)[1]}}
    },
  },
  {
   ...
  }
]
2 Likes
Nice! That looks great! Glad it's working