Plotly charts cannot do horizontal bar charts correctly

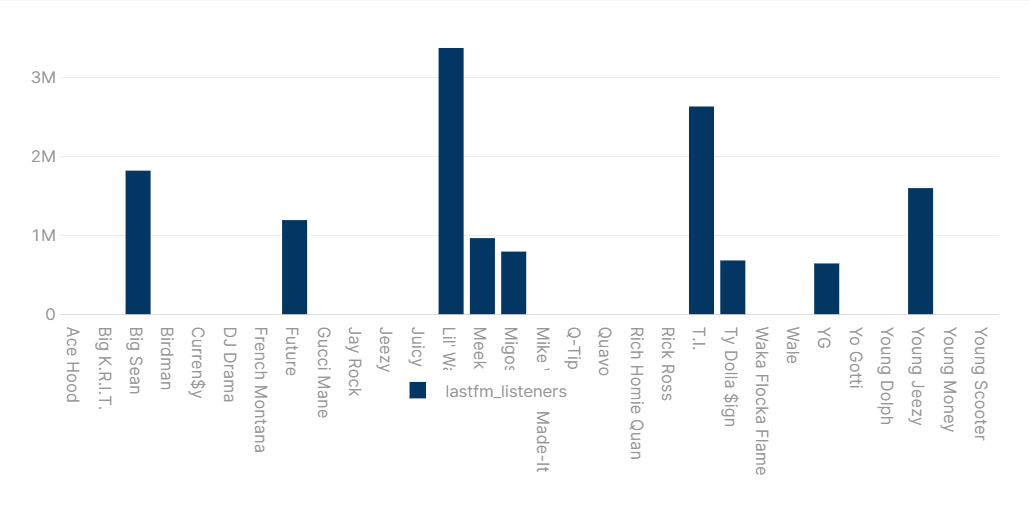
I create my bar chart like so and it works like so:

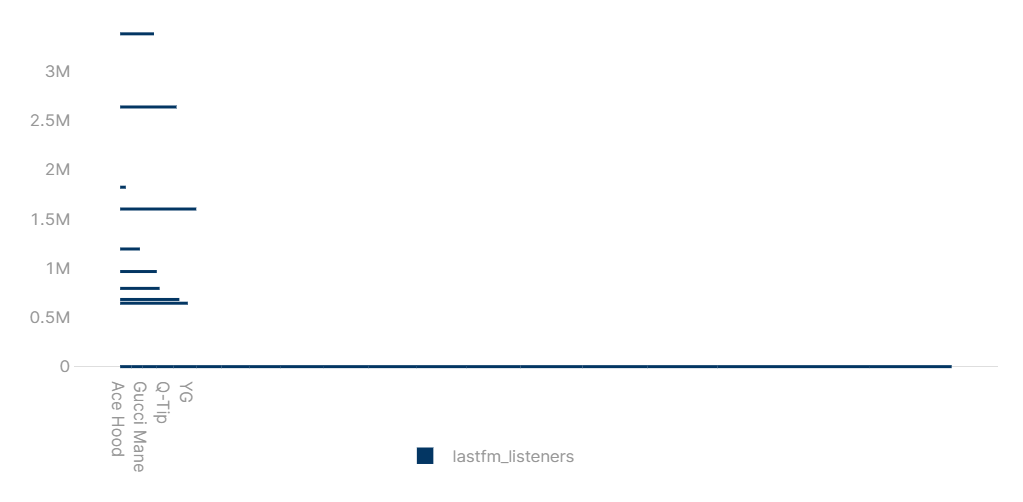
But when I add the orientation: 'h' property it looks like this:

Here is my Plotly data json:

[
  {
    "name": "lastfm_listeners",
    "orientation": "h",
    "x": {{formatDataAsObject(qryChartlastFmListeners.data)['artist']}},
    "y": {{formatDataAsObject(qryChartlastFmListeners.data)['lastfm_listeners']}},
    "type": "bar",
    "hovertemplate": "<b>%{x}</b><br>%{fullData.name}: %{y}<extra></extra>",
    "transforms": [
      {
        "type": "sort",
        "target": {{formatDataAsObject(qryChartlastFmListeners.data)['artist']}},
        "order": "ascending"
      },
      {
        "type": "aggregate",
        "groups": {{formatDataAsObject(qryChartlastFmListeners.data)['artist']}},
        "aggregations": [
          {
            "target": "y",
            "func": "sum",
            "enabled": true
          }
        ]
      }
    ],
    "marker": {
      "color": "#033663"
    }
  }
]

I also tried simplifying it to the basics with no changes:


  {
    "orientation": "h",
    "x": {{formatDataAsObject(qryChartlastFmListeners.data)['artist']}},
    "y": {{formatDataAsObject(qryChartlastFmListeners.data)['lastfm_listeners']}},
    "type": "bar"
  }
]

I have also tried swapping the x/y values which makes things worse.

Ok got it figure out. "type": "linear", on the yaxis layout JSON was the culprit, though I admit to not know why. Set the layout to 'Plotly Json' and remove that line entirely and it works.

"yaxis": {
    "title": {
      "text": "",
      "standoff": 6,
      "font": {
        "size": 12
      }
    },
    // "type": "linear", This is the culprit
    "tickformat": "",
    "automargin": true,
    "fixedrange": true,
    "zerolinecolor": "#DEDEDE"
  }
}

@bradlymathews I'm struggling with this currently. I added in "orientation": "h" to the Plotly data JSON and removed "type": "linear" from the layout JSON yet my graph is still messed up. Screen Shot 2021-12-27 at 1.39.25 PM

Anyone from the Retool team able to help out with flipping a graph horizontally?

Hey, @bryan! Can you share the plotly JSON of your chart?

Hi @Jay! I was actually able to figure out switching the chart to horizontal by switching the X and Y values soon after I posted.

Maybe you'd be able to help me out with another portion, though. I'm trying to figure out how to add in label overlays onto the chart to display the number that each column represents. I was able to figure it out to start with the Plotly documentation, but the default font is too small and unreadable and I can't figure out how to resize.

Here's how my chart looks now (with the labels censored)

And the data JSON:

[
  {
    "name": "tot_tests_administered",
    "orientation": "h",
    "y": {{formatDataAsObject(summedSchoolIndiesVT.data).dist_name}},
    "x": {{formatDataAsObject(summedSchoolIndiesVT.data)['tot_tests_administered']}},
    "type": "bar",
    "text": {{formatDataAsObject(summedSchoolIndiesVT.data)['tot_tests_administered']}},
    "textposition": "auto",
    "hovertemplate": "<b>%{x}</b><br>%{fullData.name}: %{y}<extra></extra>",
    "transforms": [
      {
        "type": "sort",
        "target": {{formatDataAsObject(summedSchoolIndiesVT.data).dist_name}},
        "order": "descending"
      },
      {
        "type": "aggregate",
        "groups": {{formatDataAsObject(summedSchoolIndiesVT.data).dist_name}},
        "aggregations": [
          {
            "target": "y",
            "func": "sum",
            "enabled": true
          }
        ]
      }
    ],
    "marker": {
      "color": "#D47E2F"
    }
  }
]

And the Layout JSON:

{
  "title": {
    "text": "Total Tests by Independent School",
    "font": {
      "color": "#3D3D3D",
      "size": 16
    }
  },
  "font": {
    "family": "Inter",
    "color": "#3D3D3D",
  },
  "showlegend": false,
  "legend": {
    "xanchor": "center",
    "x": 0.45,
    "y": -0.2,
    "orientation": "h"
  },
  "margin": {
    "l": 72,
    "r": 24,
    "t": 80,
    "b": 72,
    "pad": 2
  },
  "hovermode": "closest",
  "hoverlabel": {
    "bgcolor": "#000",
    "bordercolor": "#000",
    "font": {
      "color": "#fff",
      "family": "Inter",
      "size": 12
    }
  },
  "clickmode": "select+event",
  "dragmode": "select",
  "xaxis": {
    "title": {
      "standoff": 6,
      "font": {
        "size": 12
      }
    },
    "automargin": true,
    "fixedrange": true,
    "gridcolor": "#fff",
    "zerolinecolor": "#fff"
  },
  "yaxis": {
    "title": {
      "standoff": 6,
      "font": {
        "size": 12
      }
    },
    "type": "bar",
    "automargin": true,
    "fixedrange": true,
    "zerolinecolor": "#DEDEDE"
  }
}
2 Likes

Hey @bryan — stepping in here for Jay real quick. It looks like you can change the font-size by adding a size key to the font layout object, for example:

{
"title": {
"text": "Total Tests by Independent School",
"font": {
"color": "#3D3D3D",
"size": 16
}
},
"font": {
"family": "Inter",
"color": "#3D3D3D",
"size":20
},
"showlegend": false,
"legend": {
"xanchor": "center",
"x": 0.45,
"y": -0.2,
"orientation": "h"
},
"margin": {
"l": 72,
"r": 24,
"t": 80,
"b": 72,
"pad": 2
},
"hovermode": "closest",
"hoverlabel": {
"bgcolor": "#000",
"bordercolor": "#000",
"font": {
"color": "#fff",
"family": "Inter",
"size": 12
}
},
"clickmode": "select+event",
"dragmode": "select",
"xaxis": {
"title": {
"standoff": 6,
"font": {
"size": 12
}
},
"automargin": true,
"fixedrange": true,
"gridcolor": "#fff",
"zerolinecolor": "#fff"
},
"yaxis": {
"title": {
"standoff": 6,
"font": {
"size": 12
}
},
"type": "bar",
"automargin": true,
"fixedrange": true,
"zerolinecolor": "#DEDEDE"
}
}

Does adding this size key to your base level font object work for your use case here?

This doesn't change the size of the text displayed on the chart, it only changes the size of the labels on the y-axis.

Ah I see, sorry it can be a little difficult to test this without taking a look at this from your app. Would it be alright if we stepped into your app from our end to troubleshoot here? If so, would you mind messaging into support chat? I'll update this thread once we find a working solution! :slight_smile: