Using the following Plotly JSON content:
[
  {
    "name": 'SF Zoo',
    "x": ['giraffes', 'orangutans', 'monkeys'],
    "y": [20,14,23],
    "type": "bar",
    "marker": {
      "pattern": {
        "shape": "x"
      }
    }
  },
  {
    "name": 'LA Zoo',
    "x":  ['giraffes', 'orangutans', 'monkeys'],
    "y": [12,18,29],
    "type": "bar",
  }
]
and the following layout
{
  "barmode": "stack",
  "barnorm": "percent"
}
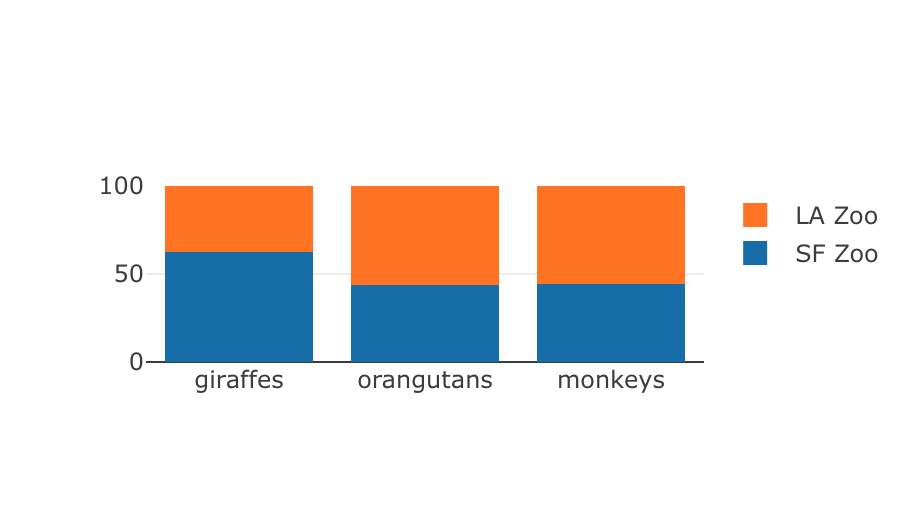
I can't make plotly pattern the plot (i.e, I get this:
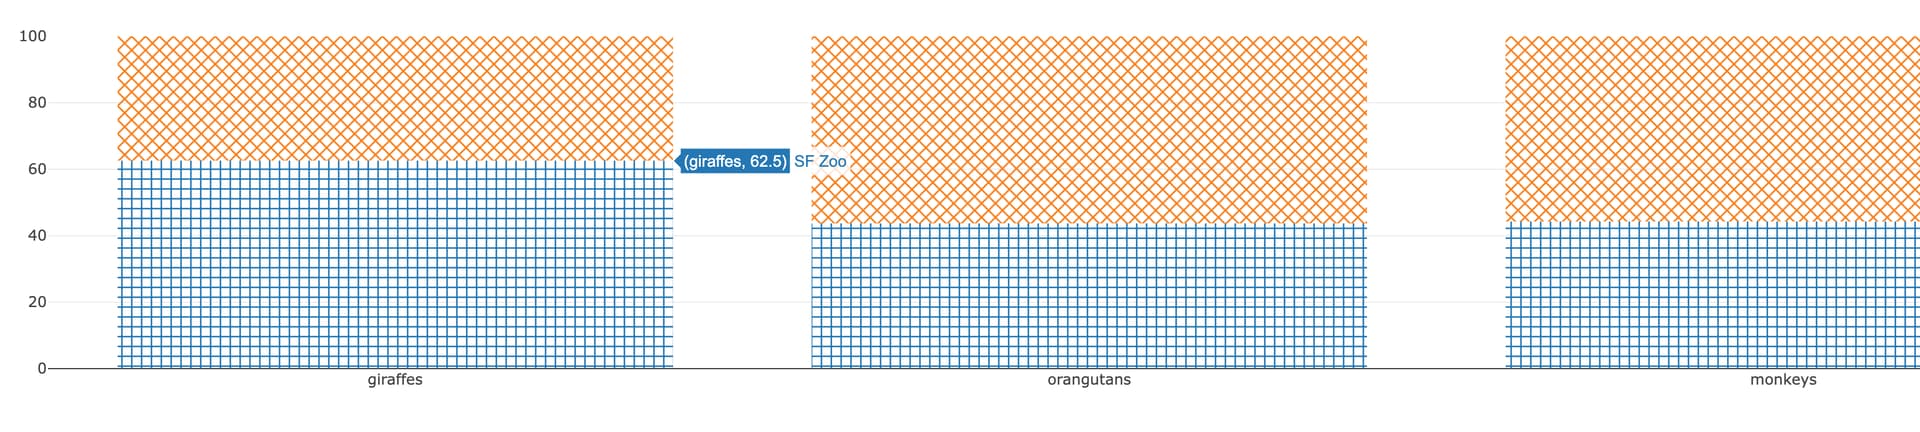
instead of this
Using Plotly on codepen work as expected
1 Like
Tess
September 22, 2023, 9:29pm
2
Hi @susgadol It looks like this is a bug where pattern properties aren't supported
1 Like
Hey @Tess , any update on a resolution for this bug? Would really love to use this feature.
Tess
January 12, 2024, 6:35pm
4
Hi @jericsinger Thanks for checking in!
We haven't been able to prioritize this one yet custom component instead of our native chart component, which is powered by plotly
Here's the plotly doc for getting started
Understood @Tess . Would you mind sharing the iFrame code you used in your response to get me started? Thanks in advance!
Tess
January 12, 2024, 11:21pm
6
Yep
<head>
<script src="https://cdn.plot.ly/plotly-2.27.0.min.js" charset="utf-8">
</script>
<script>
var trace1 = {
  x: ['Liam', 'Sophie', 'Jacob', 'Mia', 'William', 'Olivia'],
  y: [8.0, 8.0, 12.0, 12.0, 13.0, 20.0],
  type: 'bar',
  text: ['4.17 below the mean', '4.17 below the mean', '0.17 below the mean', '0.17 below the mean', '0.83 above the mean', '7.83 above the mean'],
  marker: {
    color: 'rgb(142,124,195)',
    pattern: {
      shape: 'x'
    }
  }
};

var data = [trace1];

var layout = {
  title: 'Number of Graphs Made this Week',
  font:{
    family: 'Raleway, sans-serif'
  },
  showlegend: false,
  xaxis: {
    tickangle: -45
  },
  yaxis: {
    zeroline: false,
    gridwidth: 2
  },
  bargap :0.05
};

Plotly.newPlot('myDiv', data, layout);
</script>
</head>
<body>
	<div id='myDiv'><!-- Plotly chart will be drawn inside this DIV --></div>
</body>
1 Like
Hi Tess - I've found another instance where Retool's Plotly ignores parameters. In this case, the marker.color property. Two questions:
1 - is there a timeline for fixing this?
data:
[
layout:
Also, can you share the tsx code of the plotly custom component?
I've found out that this is a limitation of plotly, not retool (i.e. Plotly cannot color individual bars in waterfall charts).
I've overcame this in CSS
{{ Array.from({length: getWaterfallData.value.length}, (_, i) =>
  `g.point:nth-of-type(${i + 1}) path {
  fill: ` + getWaterfallData.value[i].color + ` !important;
  stroke: ` + getWaterfallData.value[i].color + ` !important;
  }`).join('\n')
}}