Chart Component - Customdata / Hovertemplate

Good evening,

I am trying to expand my hovertemplate to include several dimensions of customdata.

I can get it to work with one:

"name": "merchant_services_view.totalProviderMarginProjectCurrency",
"x": {{formatDataAsObject(TableQuery.data.data)['merchant_services_view.volume']}},
"y": {{formatDataAsObject(TableQuery.data.data)['merchant_services_view.totalProviderMarginProjectCurrency']}},
"type": "scatter",
"hovertemplate": "<b>%{fullData.name}</b><br>Volume: %{x} <br>Margin: %{y}<br>Project ID: %{customdata}<br>Pricing Type:%{customdata}<extra></extra>",
"customdata": {{formatDataAsObject(TableQuery.data.data)['merchant_services_view.projectId']}}

However, i have no luck including further dimensions to the customdata - Have anyone succeeded in this or have suggestion for the approach?

As you can see in the screenshot, the customdata projectId does appear correctly, however no luck in adding aditional data

bump - anyone? :slight_smile:

Hey, same issue here. Can't make customdata working for additional data points.

As you can see the customdata is not working:

Here is the plotly code:

[
  {
    "name": {{ interest_trend.data.therapeutic_area_names[0] }},
    "x": {{interest_trend.data['days_since_opportunity_creation']}},
    "y": {{interest_trend.data['median_cumul_positive_interests']}},
    "type": "line",
    "hovertemplate": "<b>%{x}</b><br>%{fullData.name}: %{y}<extra></extra>",
    "transforms": [
      {
        "type": "sort",
        "target": {{interest_trend.data['days_since_opportunity_creation']}},
        "order": "ascending"
      }
    ],
    "marker": {
      "color": "#A1DAFE"
    },
    "mode": "lines",
    "line": {"dash": "dash", "width": 4}
  },
  {
    "name": {{ interest_trend.data.trial_study_id[0] }},
    "x": {{interest_trend.data['days_since_opportunity_creation']}},
    "y": {{interest_trend.data['cnt_cumul_positive_interests']}},
    "type": "line",
    "hovertemplate": "%{customdata} - %{x} days from launch<br>%{y} sites interested in the trial<extra></extra>",
    "customdata": "{{ interest_trend.data['date_day'] }}",
    "transforms": [
      {
        "type": "sort",
        "target": {{interest_trend.data['days_since_opportunity_creation']}},
        "order": "ascending"
      }
    ],
    "marker": {
      "color": "#0076C1"
    },
    "mode": "lines",
    "line": {"width": 4}
  }
]

Hey @simenn @Hugo_Hahn! I've gotten this working, actual implementation may vary depending on how the data is formatted and how many data sets you are plotting.

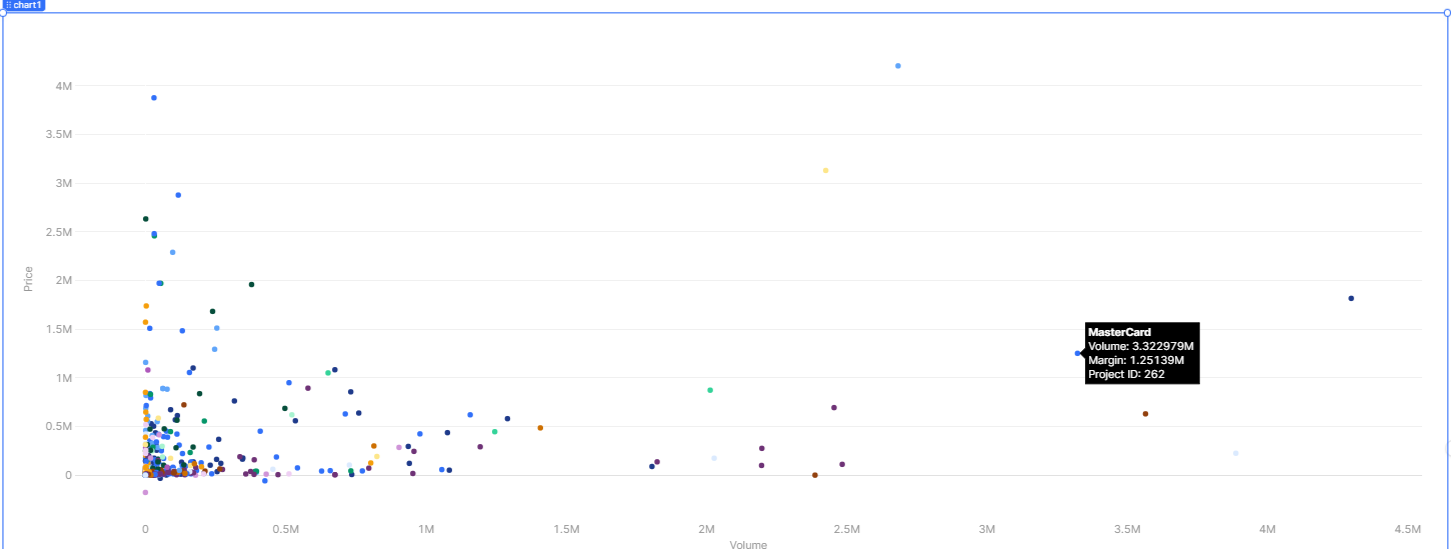
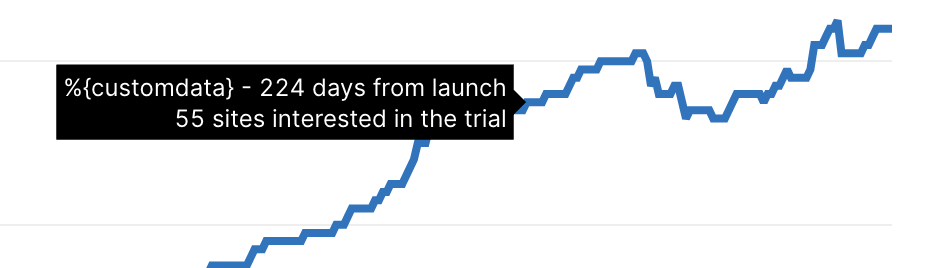
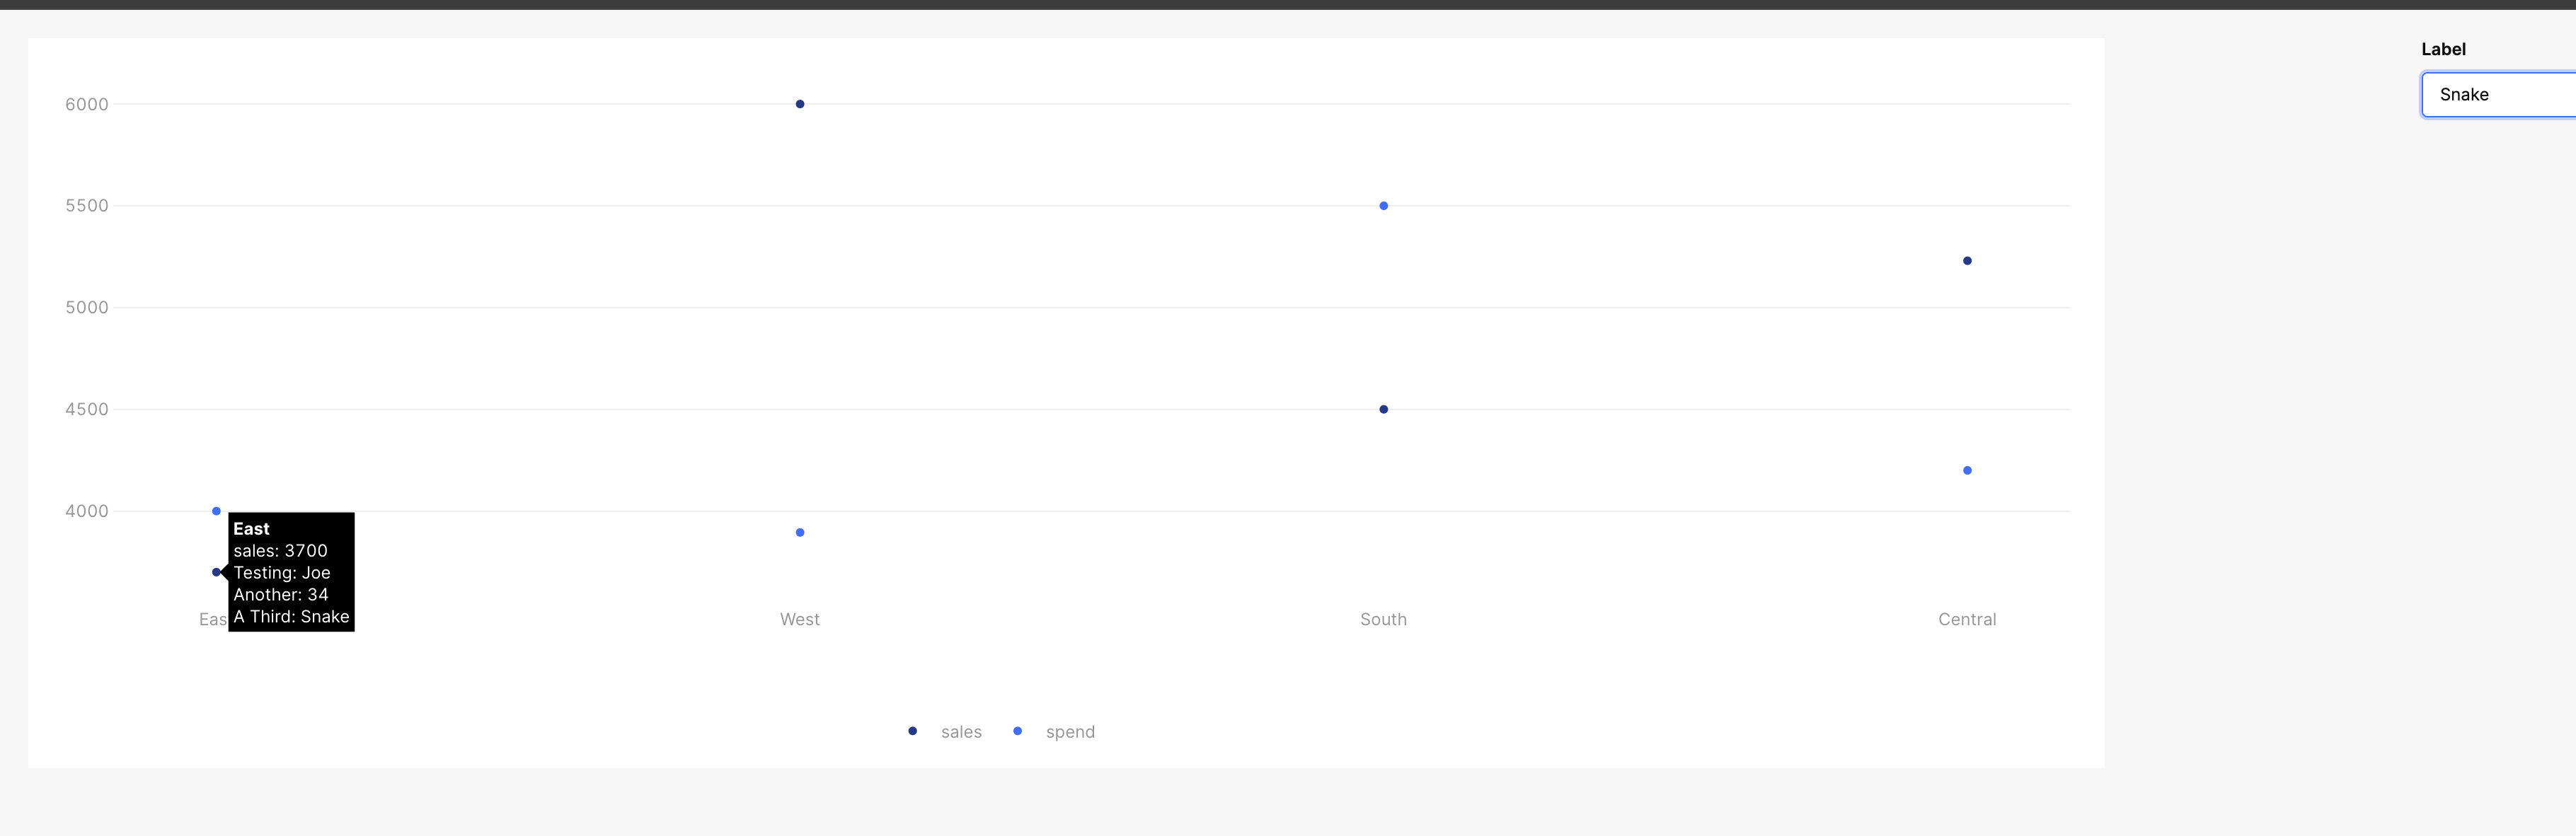
As an overview, it looks like customdata is an array of data where each element is assigned to the corresponding datum (ie: the first element in the customdata array is assigned to the first datum in the set). Knowing this, you can assign an array with n elements to each dataset that can be accessed in the hovertemplate. Here, I've assigned each datum an object (which we can key into inside the hovertemplate), and a dynamic value assigned by a component in the app.

I've attached the sample app here in case you want to play around with it as well.
PlotlyCustomdata.json (23.4 KB)

1 Like

Hello @joeBumbaca!

Thank you for your reply and effort to guide us on this.

However, i am still struggling a bit to make this work - i think i understand your solution and explanation - however for my use case it seems a bit more complicated as i dont seem to be able to access the queries in the same way as you access the "hardcoded" values.

"hovertemplate": "%{fullData.name}
Volume: %{x}
Margin: %{y}
Project ID: %{customdata[1]}
Pricing Type: %{customdata[0]}",

"customdata": [
{{ formatDataAsObject(TableQuery.data.data)['merchant_services_view.pricingType'] }},
{{ formatDataAsObject(TableQuery.data.data)['merchant_services_view.projectId'] }}
]

I might not be correct in my way of trying to access them though...

I could possibly make it work by transforming my queries etc but i would like to know for future reference if it's possible in the query-way

Hey @simenn! I'm referencing dynamic values in my example as well. Going to need a bit more information on your specific use case to understand what's happening here.

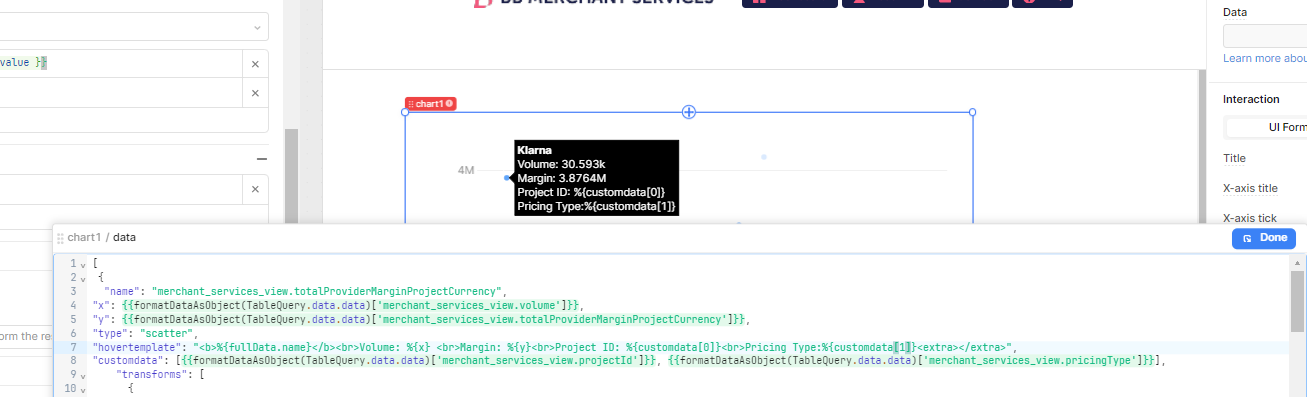
Can you share what the hover tooltip looks like with this code?
Can you share what TableQuery.data.data looks like?

Also is seems that you are passing the 'pricingTypeto the first data point, andprojectId` to the second. Are those the values that you want passed to those specific points?

Hey @joeBumbaca,

Here is what the hover looks like.

Snippet of data structure:

  {
      "merchant_services_view.product": "MasterCard",
      "merchant_services_view.settlementCountry": "Norway",
      "merchant_services_view.pricingType": "Current",
      "merchant_services_view.companyName": "i can not display this",
      "merchant_services_view.projectId": 3,
    }

in the tablequery this is the data structure

For the data points, that was actually just a typo, but it made no difference in outcome correcting it.

I just really struggle wrapping my head around this, since the data structure obviously is accepted by customdata since it works with one dataset, it shouldnt be a problem adapting it to several datasets with your method and my data structure