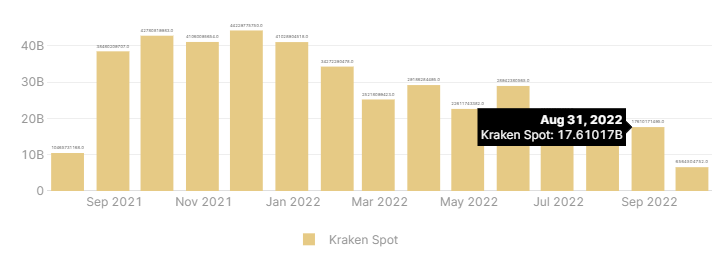
Is there a way to use "texttemplate" to do this? Is there a way to dynamically have it show the value in either B (billions) or M (millions)? Below is the current code I have for the labels:
Currently, I can use a work-around where in my dataset, I add an additional column just for the labels. E.g., column 1 is the actual value of 17610171495, and column 2 for labels is 17.610171495
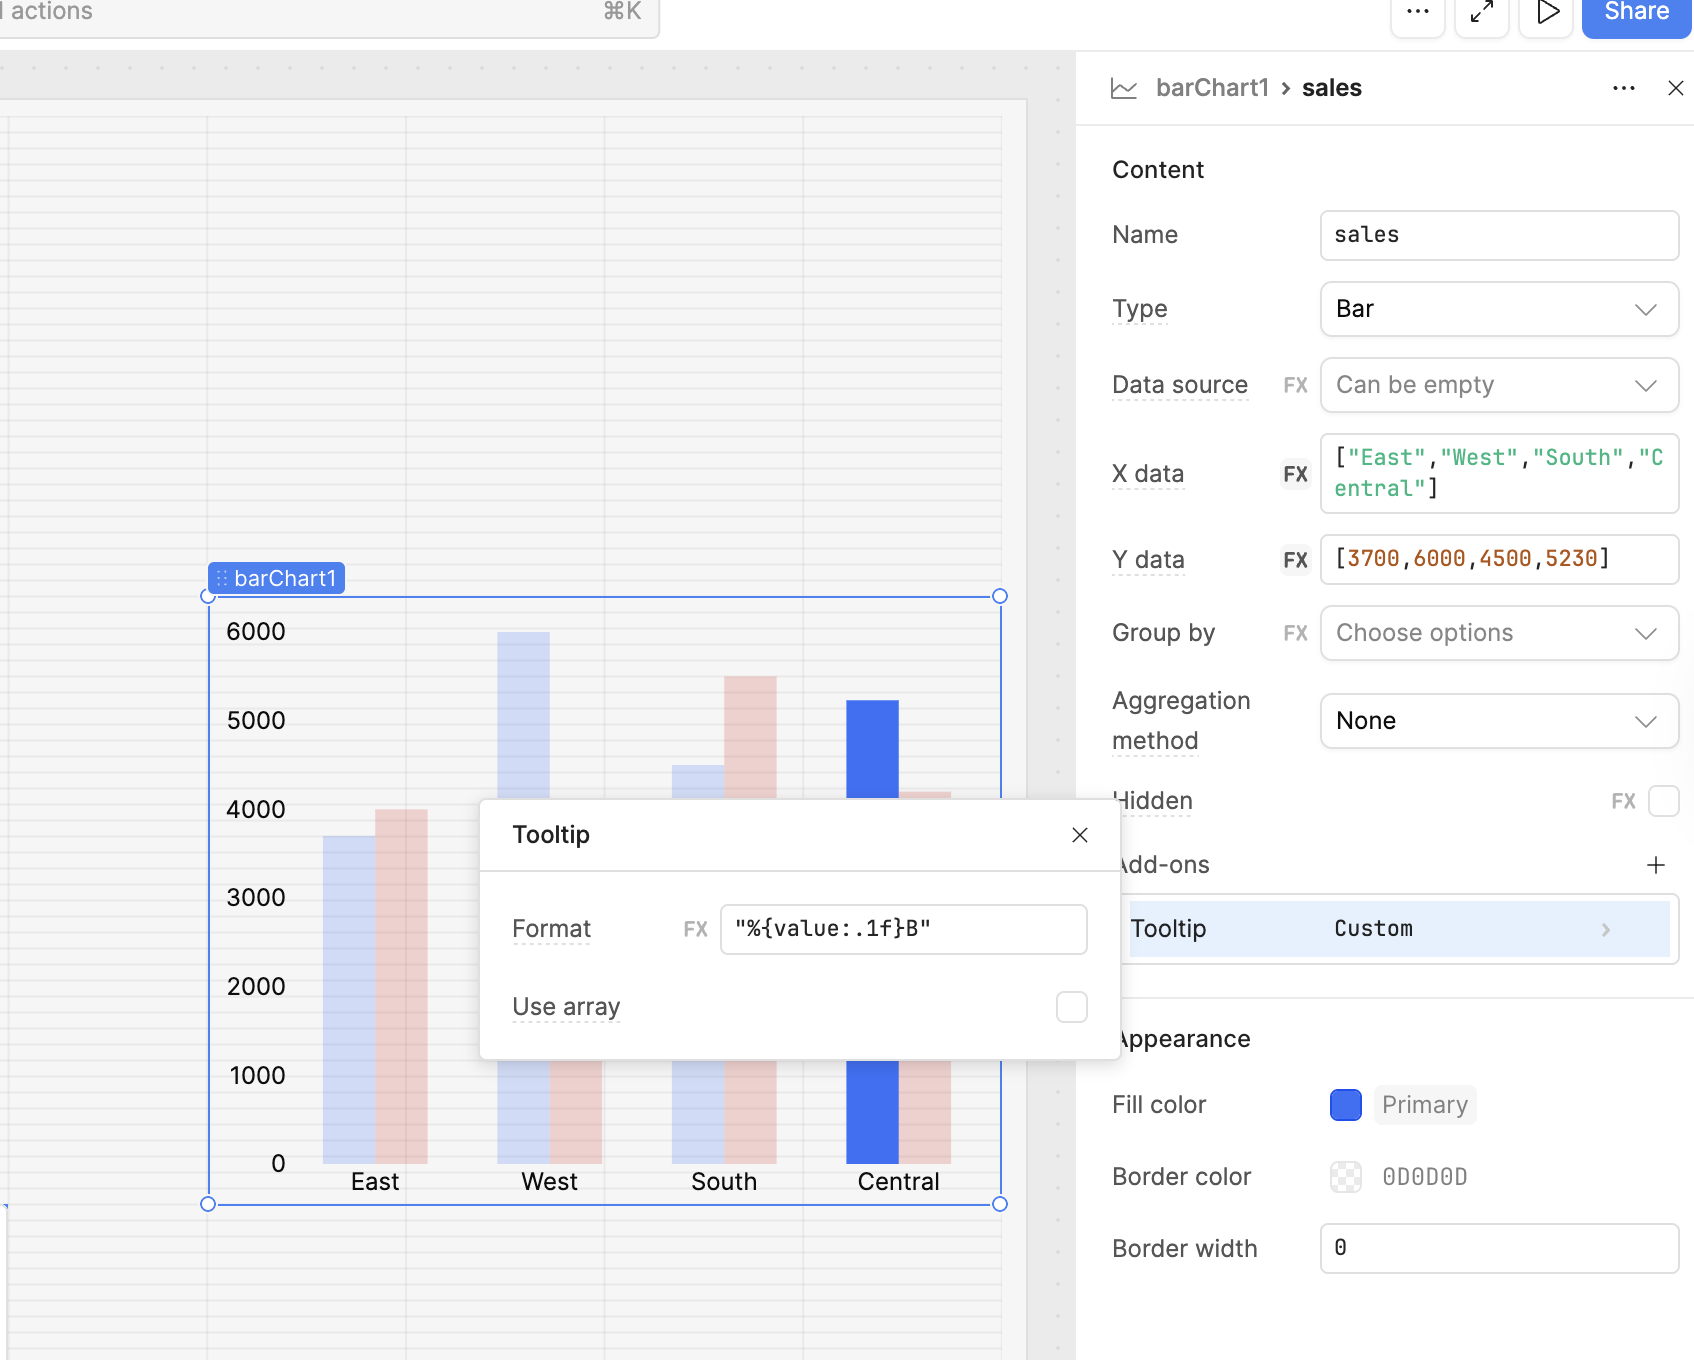
Yes, you can use texttemplate to format the values dynamically. Try something like this:
javascript
texttemplate: "%{value:.1f}B"
For dynamic scaling between Billions (B) and Millions (M), you can use a custom function in the texttemplate, such as:
template
texttemplate: %{customdata}
Then preprocess your data to return formatted strings like '17.6B' or '950M' based on the value.
On a related note, handling large-value formatting clearly is something we also prioritize in Unibee, especially when displaying usage-based analytics to customers.