Add labels to bar chart

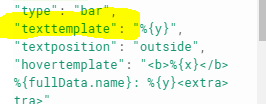
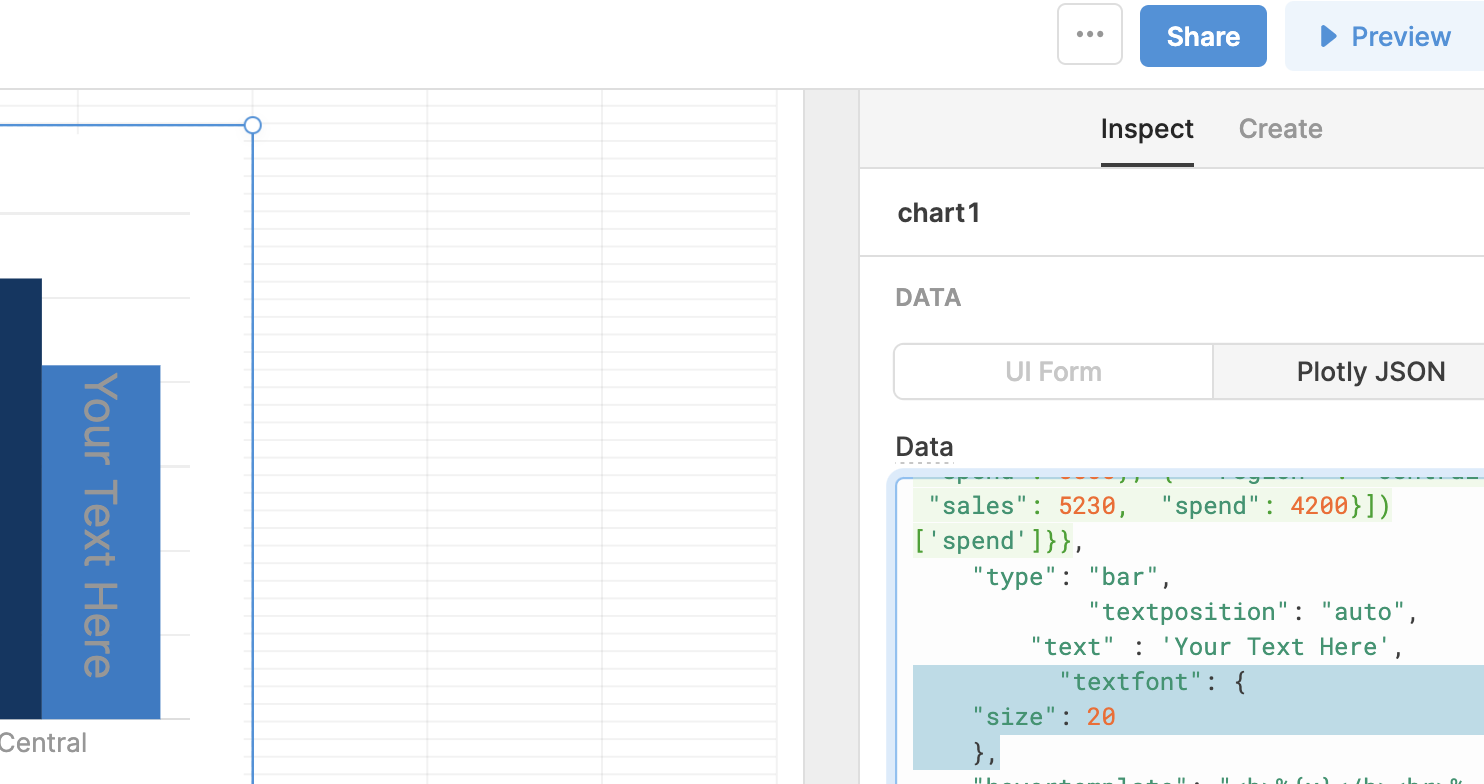
I'm creating a bar chart and want to show the value of each bar on the bar itself without the user having to hover over each bar to see the value.

I took a look at Plotly and see that it's possible using annotations but it looks like it would need to be done programmatically and I'd need to know the x and y location of each bar. Is there an easier way to do it?

Retool support got back to me in chat and said to add the below to the Data section of the Plotly JSON data. This worked for me.

"textposition": "auto",
"text" : [Your Text Here]

I also added:

"textfont": {"color":'#ffffff'},

to make the color of the labels white to be readable against the default bar color.

2 Likes

Hi All! I found a way to fix that...
image
"TextTemplate".
Hoever, I didn't found how make bigger the size of labels

Hey there! This seems to work for font size:

"textfont": {
    "size": 20
    },