Hey all !
Excited to launch this new Plotly guide because we’ve been building something we think is really cool: sankeygenerator.com.
Anyone who spends any time on Reddit will know that Sankey diagrams are a bit of a passion for data nerds. They’re a great way to visualize things like budgets, data flows and anything that shows a flow of values between points. Nevertheless, most Sankey chart generators out there have clunky user interfaces and require complicated set-up through fairly outdated interfaces.
That’s why we thought we’d test the possibilities of Plotly a bit further and make one in Retool ourselves.
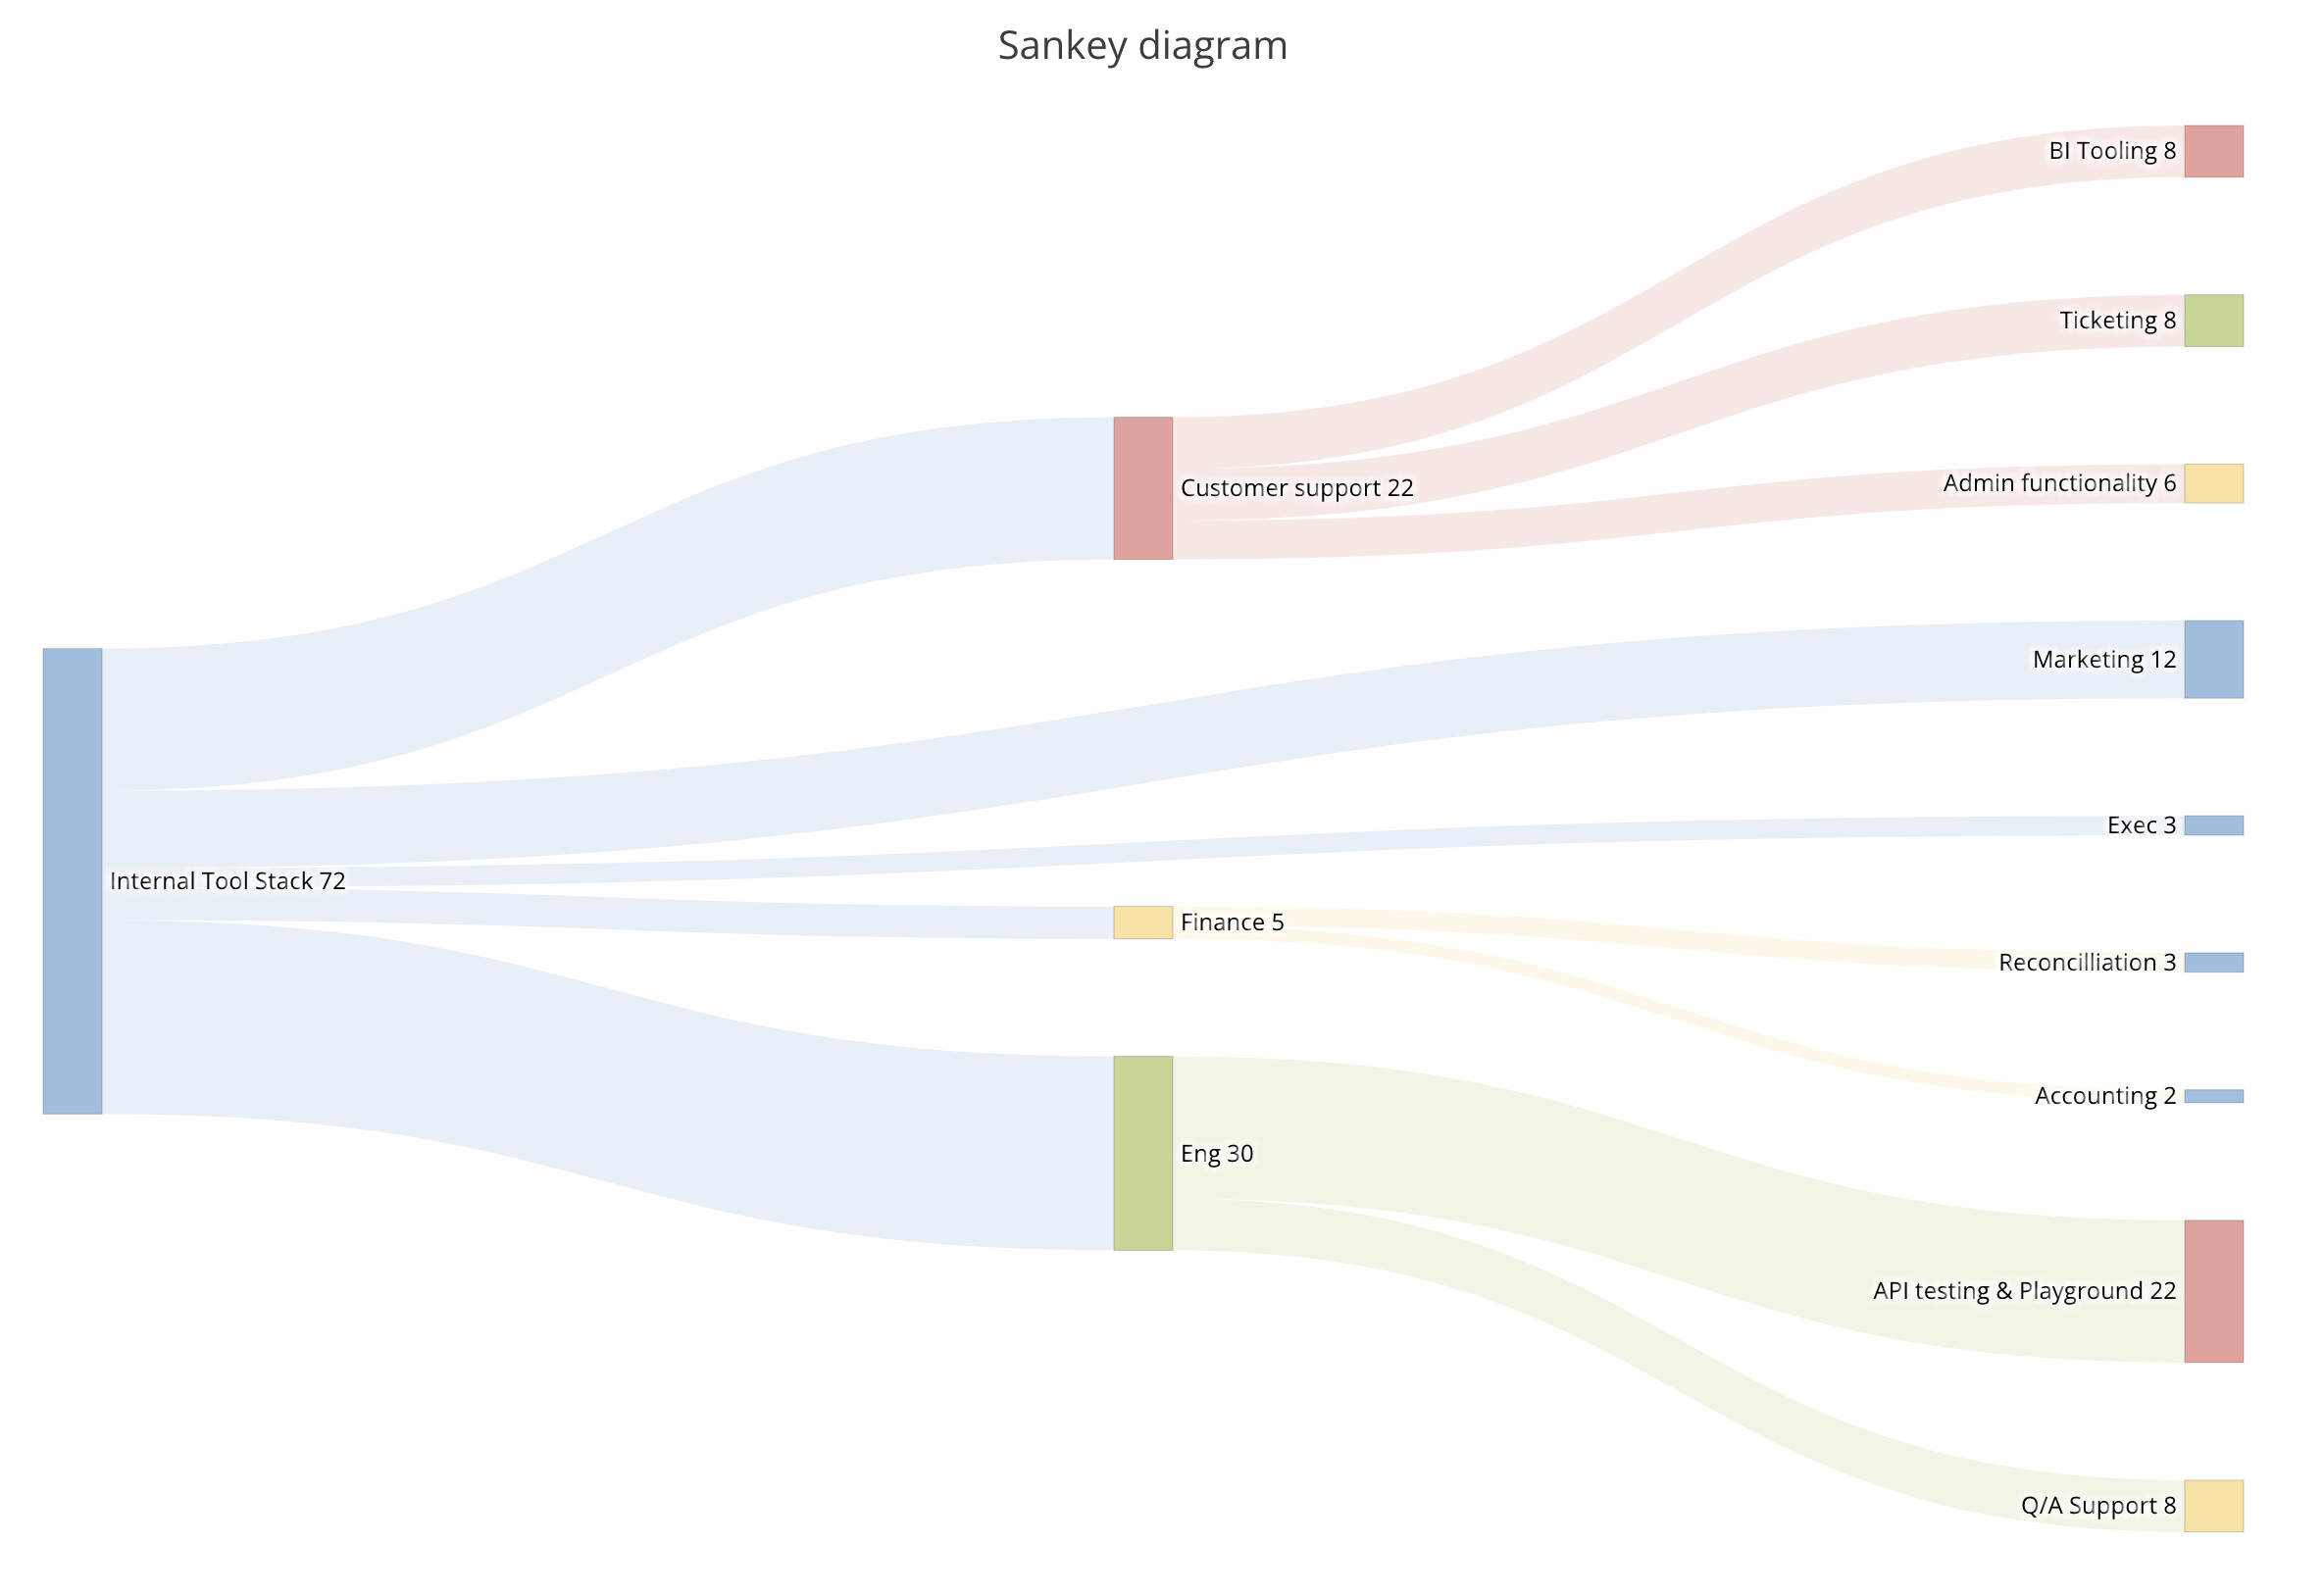
Sankeygenerator.com is a simple way to generate Sankey diagrams for free. You can even save and upload templates for later use and export to PDF.
All this was built in Retool!
You can play around with our public app (data is not exposed to us at any point) here - we’d love to hear your thoughts and feedback!You can read more about how we built it in our new Plotly guide: Charting in Retool with Plotly Part II: The Sankey Diagram