I think that custom React components are definitely the best way to go long-term and they're the advised path for adding interactive logic with third-party libraries. Outside of custom components, you'll quickly run into guardrails around access to the DOM that are part of Retool's security model.
However, if you only need to display static graphs, you can definitely do that in your app without touching custom components.
You can add the cdnjs-hosted D3 library as a custom libraries. Per the documentation, I've had the best luck with minified, UMD builds. This will make the d3 object available to your app. (although you won't have code completion, so don't let that throw you off)
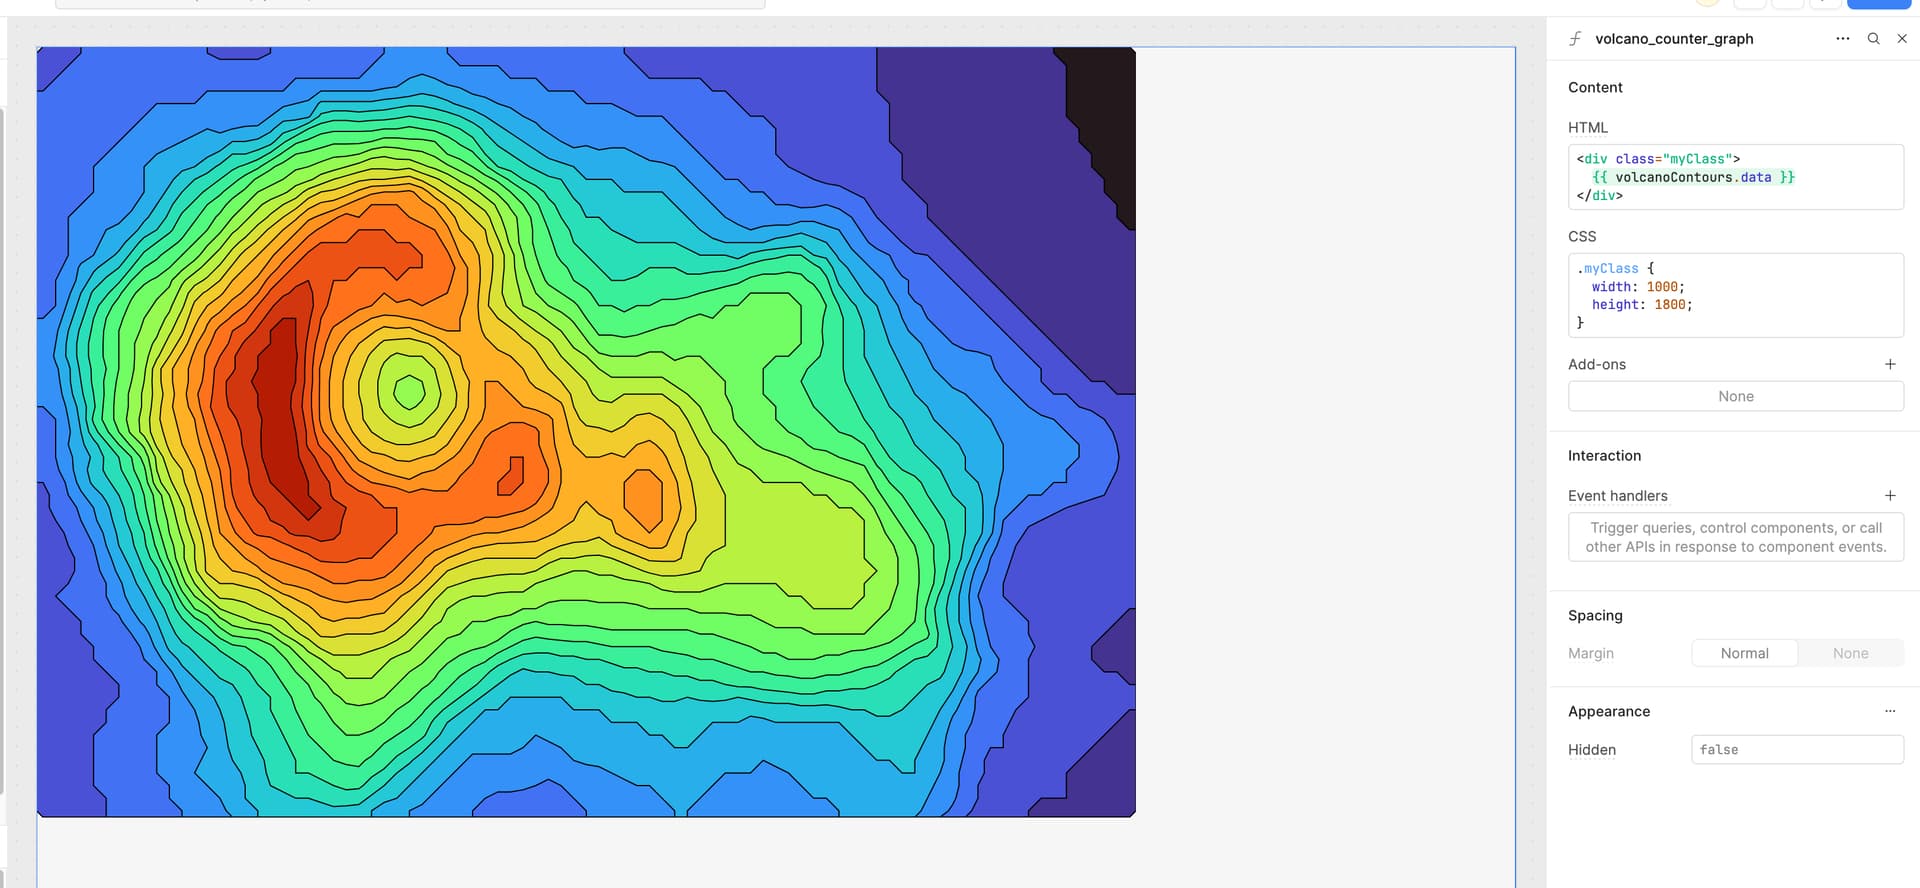
For a simple demo, I pulled the Volcano Contours topographic map from D3's examples gallery.
I downloaded the volcano.json dataset and uploaded it to my Retool Storage. I added a Retool Storage resource query, a JS query for the map logic, and an HTML element to render it.
Here's the code for the JS query:
// Decodes base64 data from Retool Storage query
// and parses the JSON string into an object
const data = JSON.parse(atob(volcano_data.data.base64Data))

const n = data.width
const m = data.height
const width = 928
const height = Math.round(m / n * width)
const path = d3.geoPath().projection(d3.geoIdentity().scale(width / n))
const contours = d3.contours().size([n, m])
const color = d3.scaleSequential(d3.interpolateTurbo).domain(d3.extent(data.values)).nice()

const svg = d3.create("svg")
    .attr("width", width)
    .attr("height", height)
    .attr("viewBox", [0, 0, width, height])
    .attr("style", "max-width: 100%; height: auto;")

svg.append("g")
    .attr("stroke", "black")
    .selectAll()
    .data(color.ticks(20))
    .join("path")
    .attr("d", d => path(contours.contour(data.values, d)))
    .attr("fill", color)

// Returns an <svg> element that can be rendered
return svg.node().outerHTML
The data content of the query after it's run will be an <svg> element that you can render in an HTML component with {{ query.data }}
I played around with a few different static graph types with good success. It seems like anything that can be statically-rendered as an SVG works well with this approach, although once you start needing animations or interactivity, you'll probably want to start working with D3 in custom components.