- My goal:
I’m trying to visualize stage-to-stage movements in a Sankey Chart using Retool’s built-in Sankey component.
2) The issue:
No matter what data I pass, the Sankey remains blank. Even a trivial two-link example won’t render any nodes or flows.
3) Steps I’ve taken to troubleshoot:
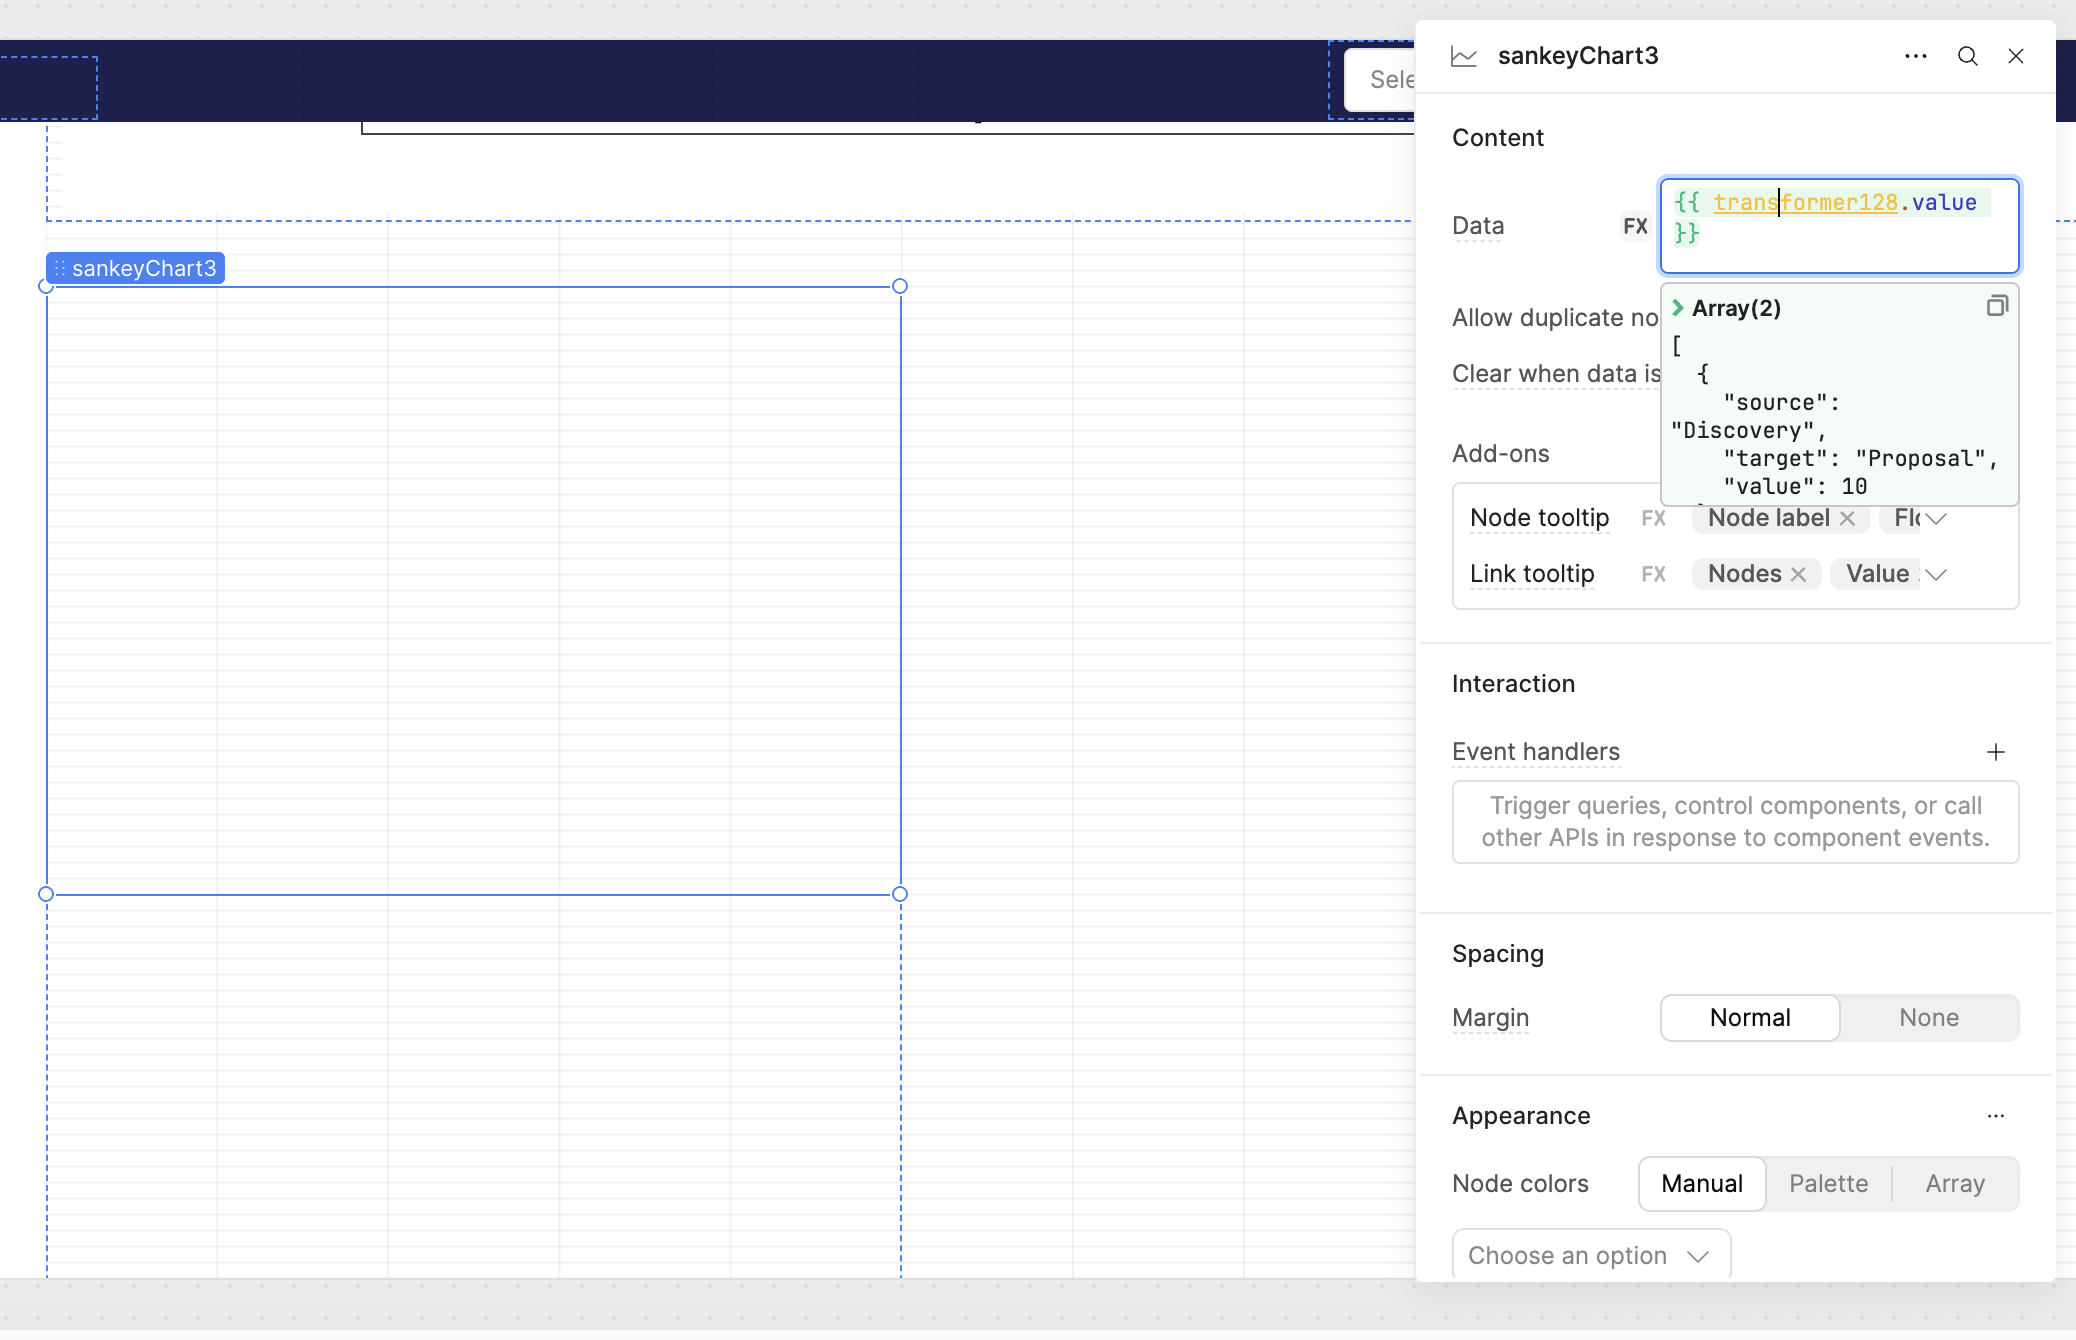
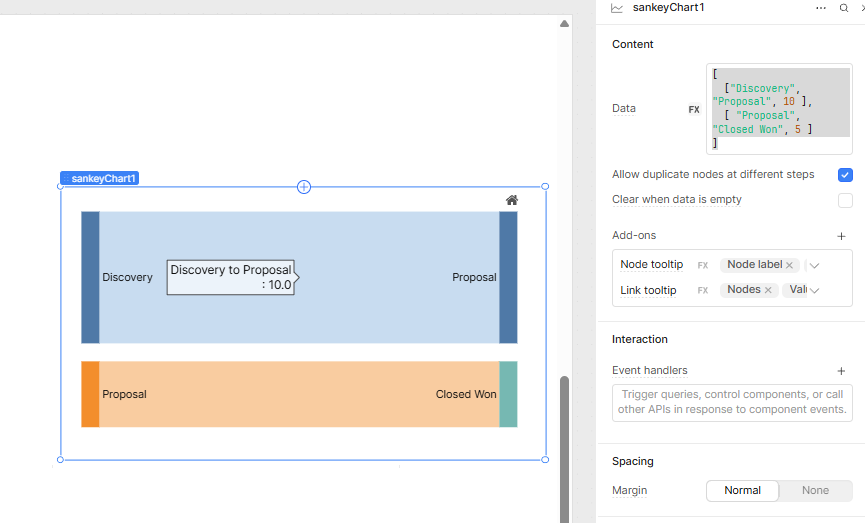
- Used a minimal dataset with no possibility of cycles, e.g.:
[
  { "source": "Discovery", "target": "Proposal", "value": 10 },
  { "source": "Proposal", "target": "Closed Won", "value": 5 }
]
- That still shows an empty chart area.
- Verified correct key names (source, target, value) in lowercase.
- Toggled “Allow duplicate nodes” in the Sankey settings.
- Removed custom tooltips (set Node tooltip to “Node label” or “Node label × Value”).
- Created a brand-new Sankey component in a fresh Retool page (no custom CSS or layout).
- Checked DevTools: no error messages about cycles or invalid data.
- Compared with Plotly Sankey: When I switch to a custom Plotly JSON chart, the same data does render a Sankey. So it’s specifically the built-in Retool Sankey that’s failing.
4) Additional info:
- Running Retool on [Cloud / Self-Hosted / Plan details].
- Attaching screenshots of the Sankey settings and the blank chart.
- Let me know if you need more logs or a shared Retool app link.
Any help or insight would be greatly appreciated. Thank you so much!