- My goal: Run the JS query on page load and update the chart with loaded data
- Issue: There is some race between chart loading and JS query execution. I am running the query on page load and it loads successfully. This query is passed as series data in bar chart. The issue is that bar chart does not refresh after query runs. When i run the query manually through button, chart refreshes. The same happens, when I delay the query by 2 seconds. How to make sure the chart refreshes or loads after the query is executed? I was trying to hide and unhide the chart, but it does not refreshes in such case.
- Steps I've taken to troubleshoot: as above
- Additional info: Cloud version
1 Like
Hey @Krysss ,
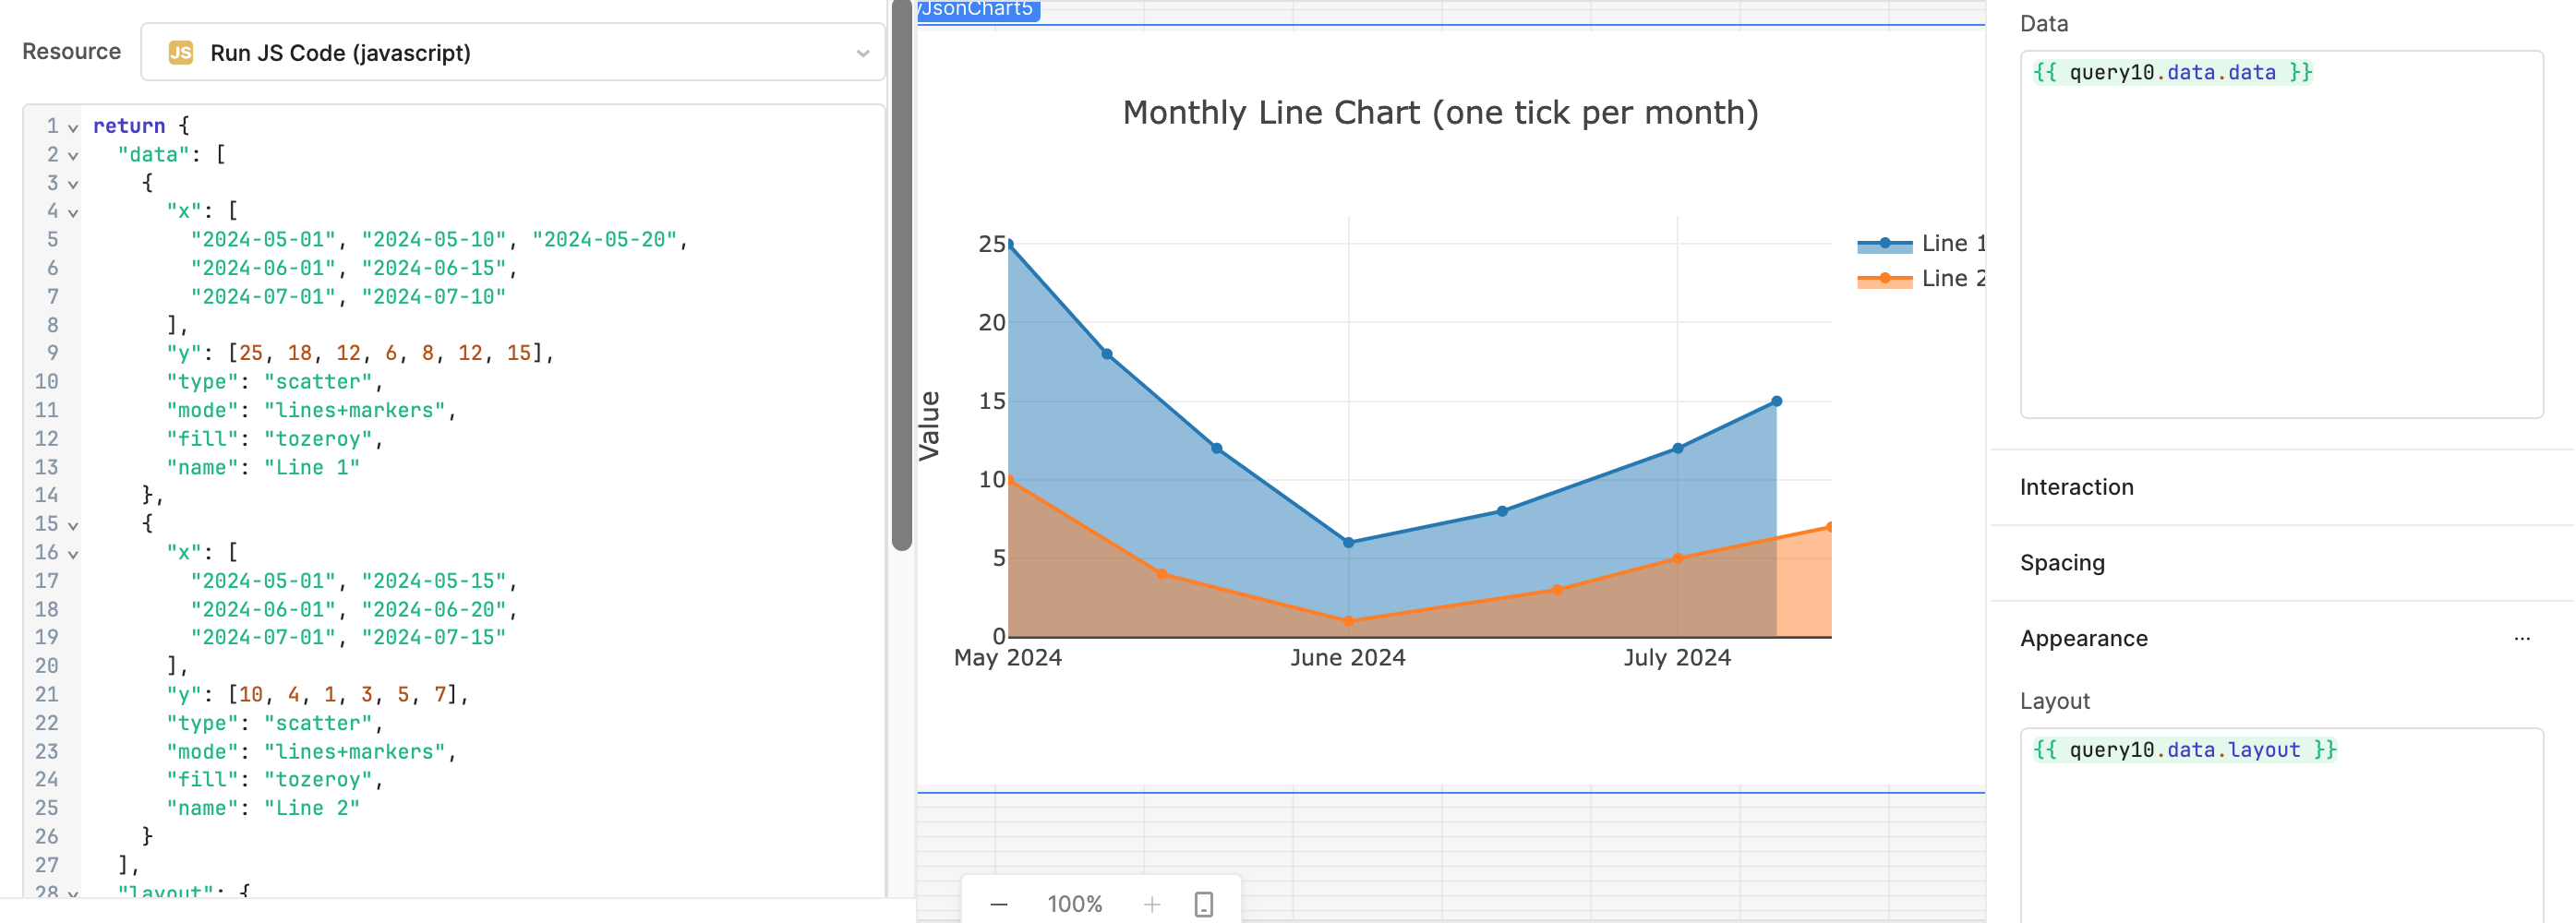
If you're using the Chart component in Retool, I highly recommend trying out the Plotly JSON chart type instead.
The advantage of using a Plotly chart is that you can dynamically update both the chart data and layout through a Transformer/Js query — making it super flexible and perfect for dynamic dashboards.
Here’s an example of a Plotly chart configuration you can use inside a Transformer/Js query:
return {
  "data": [
    {
      "x": [
        "2024-05-01", "2024-05-10", "2024-05-20",
        "2024-06-01", "2024-06-15",
        "2024-07-01", "2024-07-10"
      ],
      "y": [25, 18, 12, 6, 8, 12, 15],
      "type": "scatter",
      "mode": "lines+markers",
      "fill": "tozeroy",
      "name": "Line 1"
    },
    {
      "x": [
        "2024-05-01", "2024-05-15",
        "2024-06-01", "2024-06-20",
        "2024-07-01", "2024-07-15"
      ],
      "y": [10, 4, 1, 3, 5, 7],
      "type": "scatter",
      "mode": "lines+markers",
      "fill": "tozeroy",
      "name": "Line 2"
    }
  ],
  "layout": {
    "title": {
      "text": "Monthly Line Chart (one tick per month)",
      "x": 0.5
    },
    "xaxis": {
      "type": "date",
      "tickformat": "%B %Y",
      "tickmode": "linear",
      "dtick": "M1",
      "tick0": "2024-05-01",
      "showline": true,
      "linewidth": 1
    },
    "yaxis": {
      "title": "Value"
    },
    "showlegend": true
  }
}
Here’s what it looks like:
5 Likes
Hi @Krysss,
It does sound like there are some race conditions going on. One option is to set the chart's source to be a variable.
On success of query run, set the variable to be the data returned by the query. This way, the chart will load on page load, the query will run and the chart component will check to see if the variable's data has changed. When the variables data does change, it should refresh the component and re-render.
Let me us know if @WidleStudioLLP's suggestion is helpful as well.
5 Likes
Hi @Krysss,
Just wanted to check and see if you had found one of the suggestion options to be helpful for getting the component to re-render with the new data.
1 Like