Quickly implementing PlotlyJS examples with Chart

Since Retool's Chart component is based on PlotlyJS I've found myself digging through their docs a lot. Luckily, there are a lot of great examples on their site and many can be copied almost directly!

The basic trick here is to grab the data and layout objects defined in an example and drop those into the respective fields in the component and as long as that's all that's needed for the example you should be good to go:

1
Copy the code from the Plotly example you want to use can be copied anywhere JS can be written in your app (here we'll use a regular JS query).

2
Replace this line:

Plotly.newPlot('myDiv', data, layout);

with this:

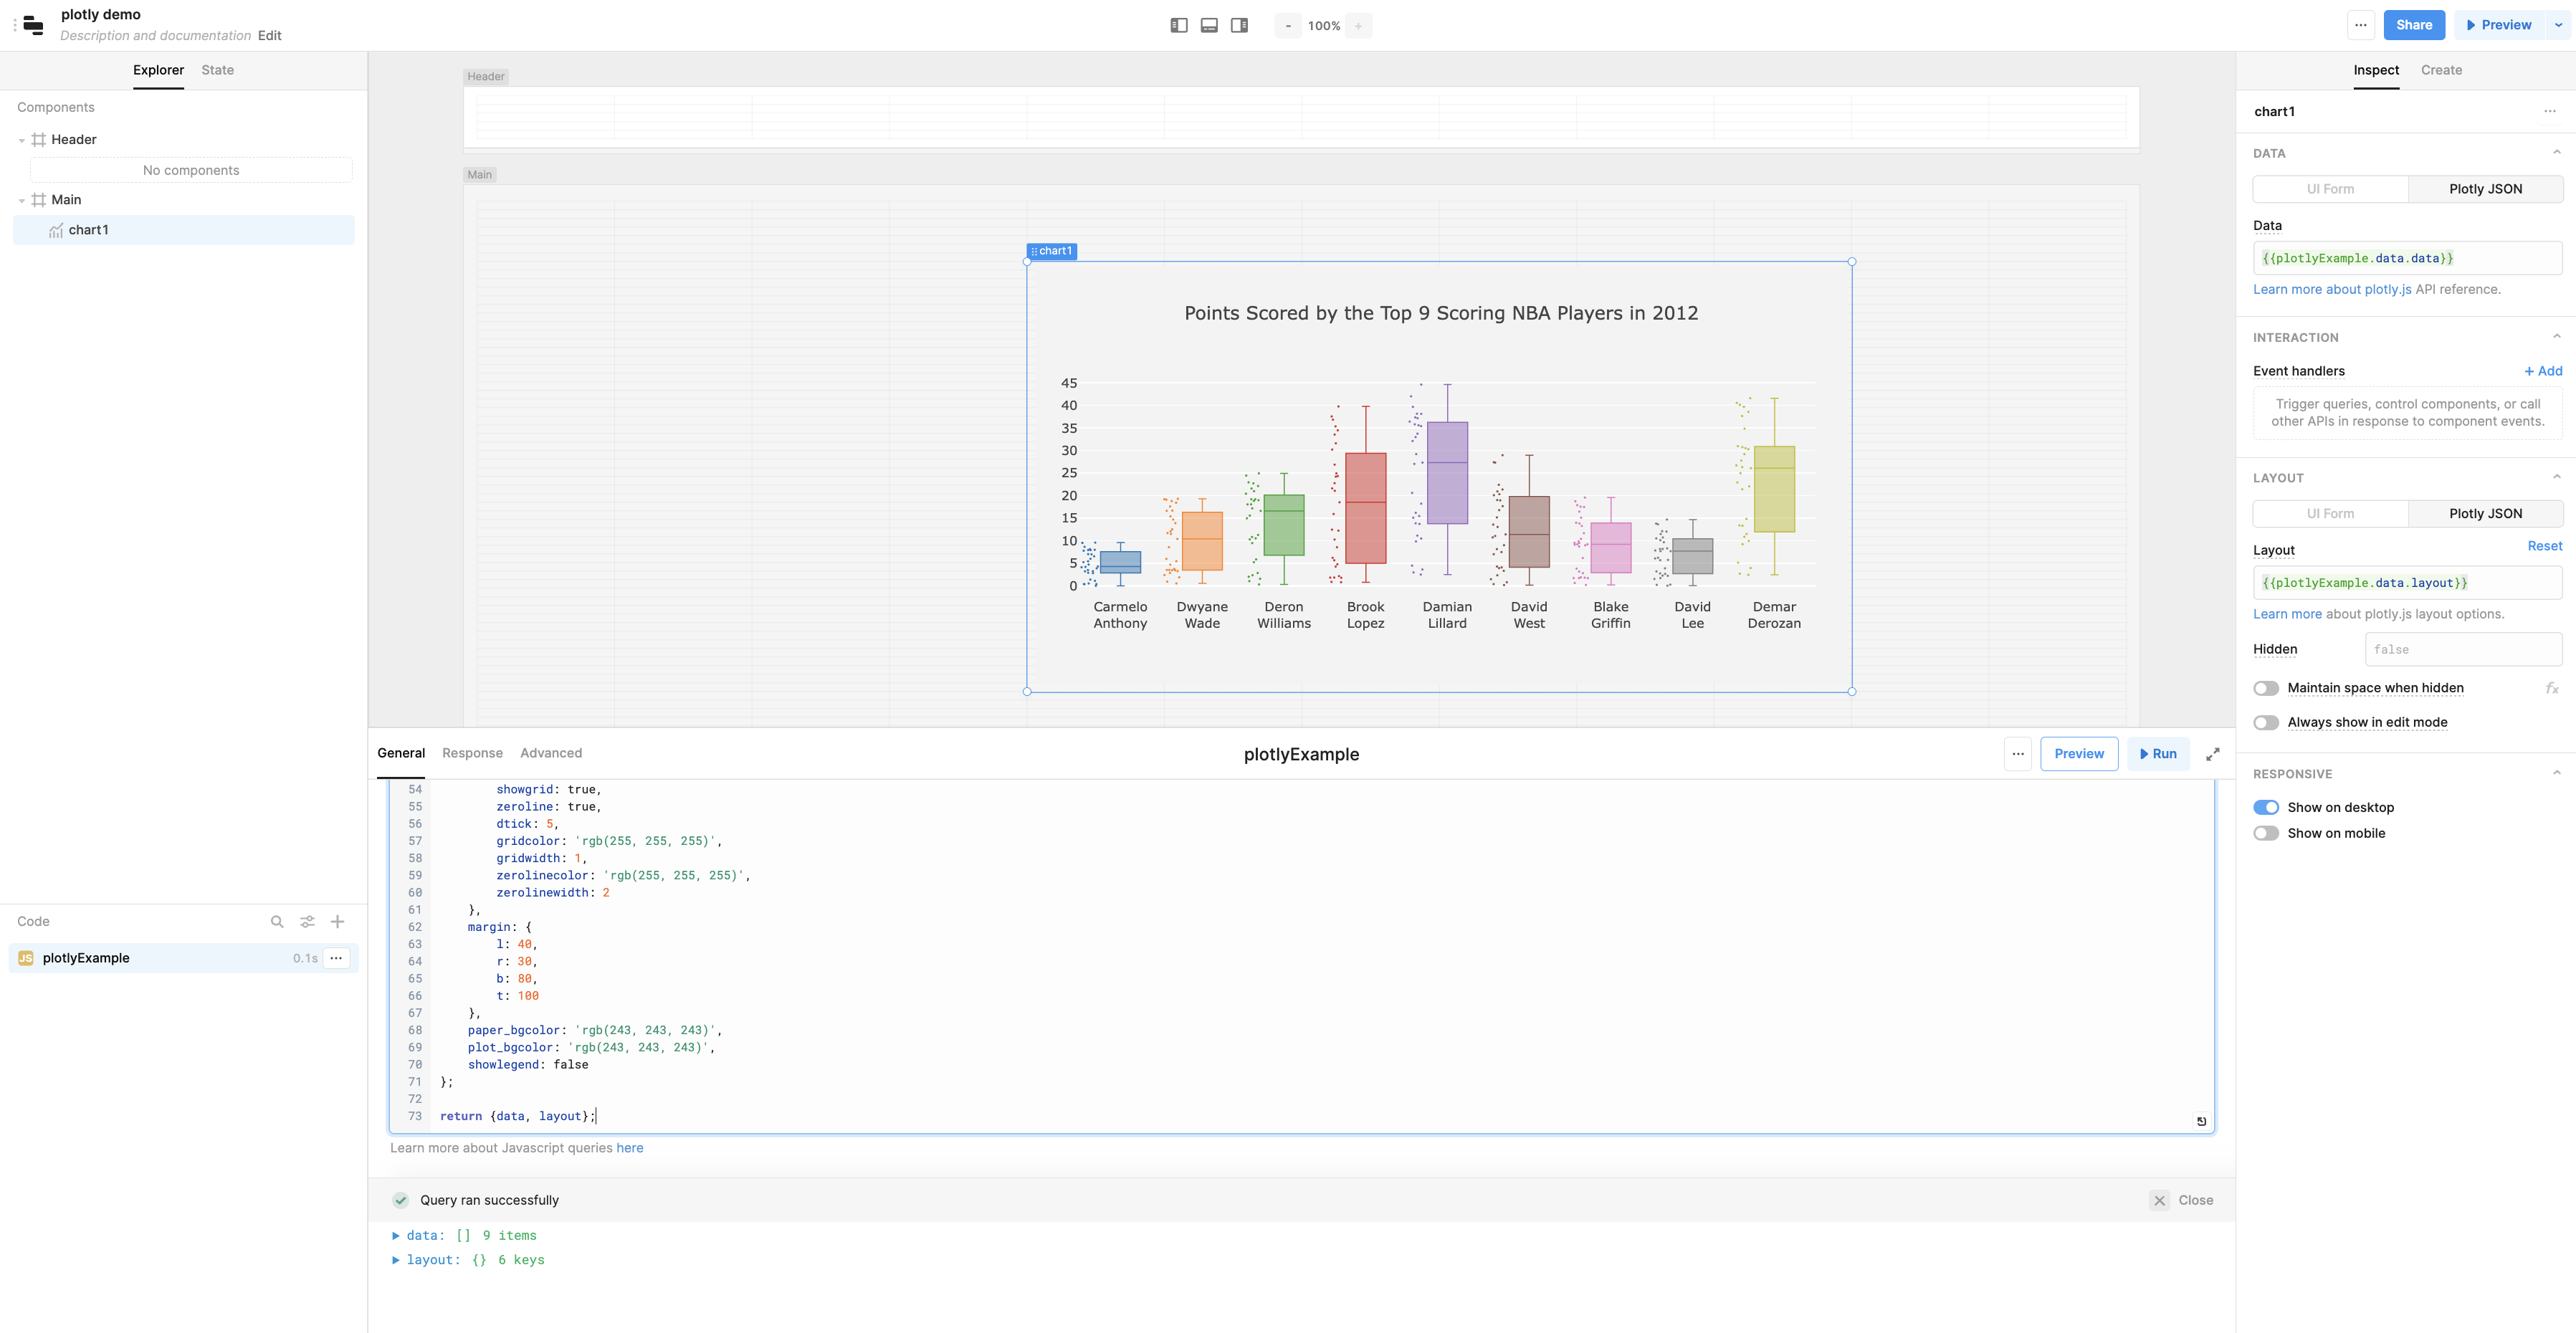
return {data, layout};

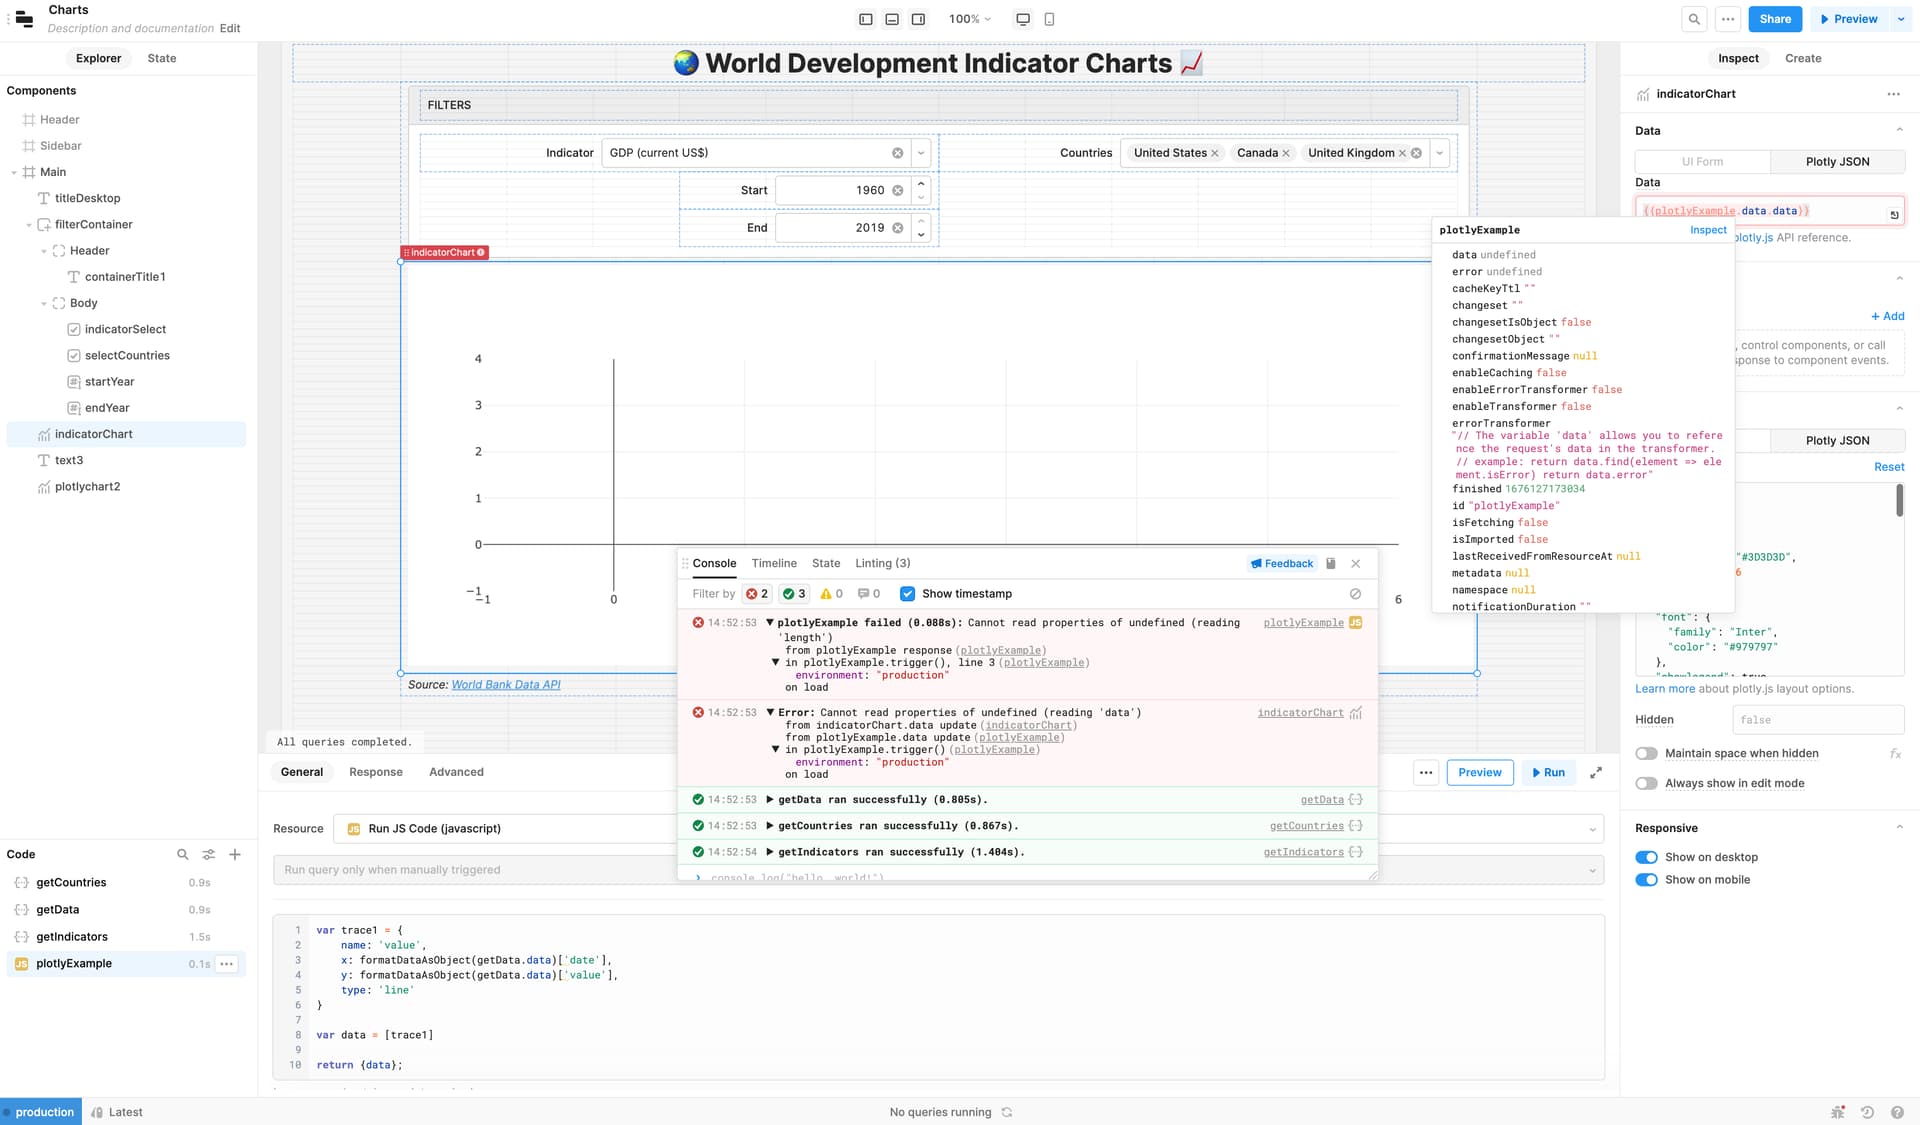
Instead of invoking the Plotly library in the script itself we just want to pass back the variables we'd be invoking it with so that they can be used in the component, where the library actually will be invoked.

3
Reference the data and layout properties in your component:
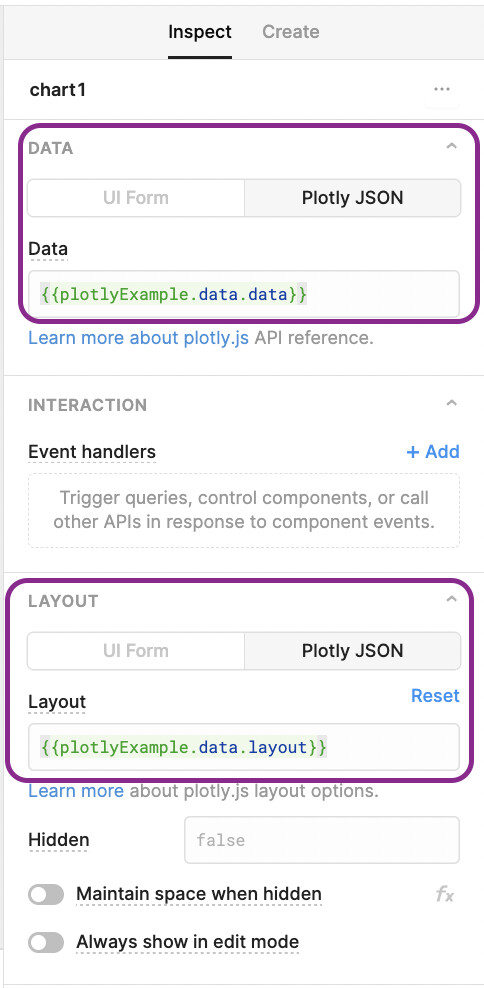
4
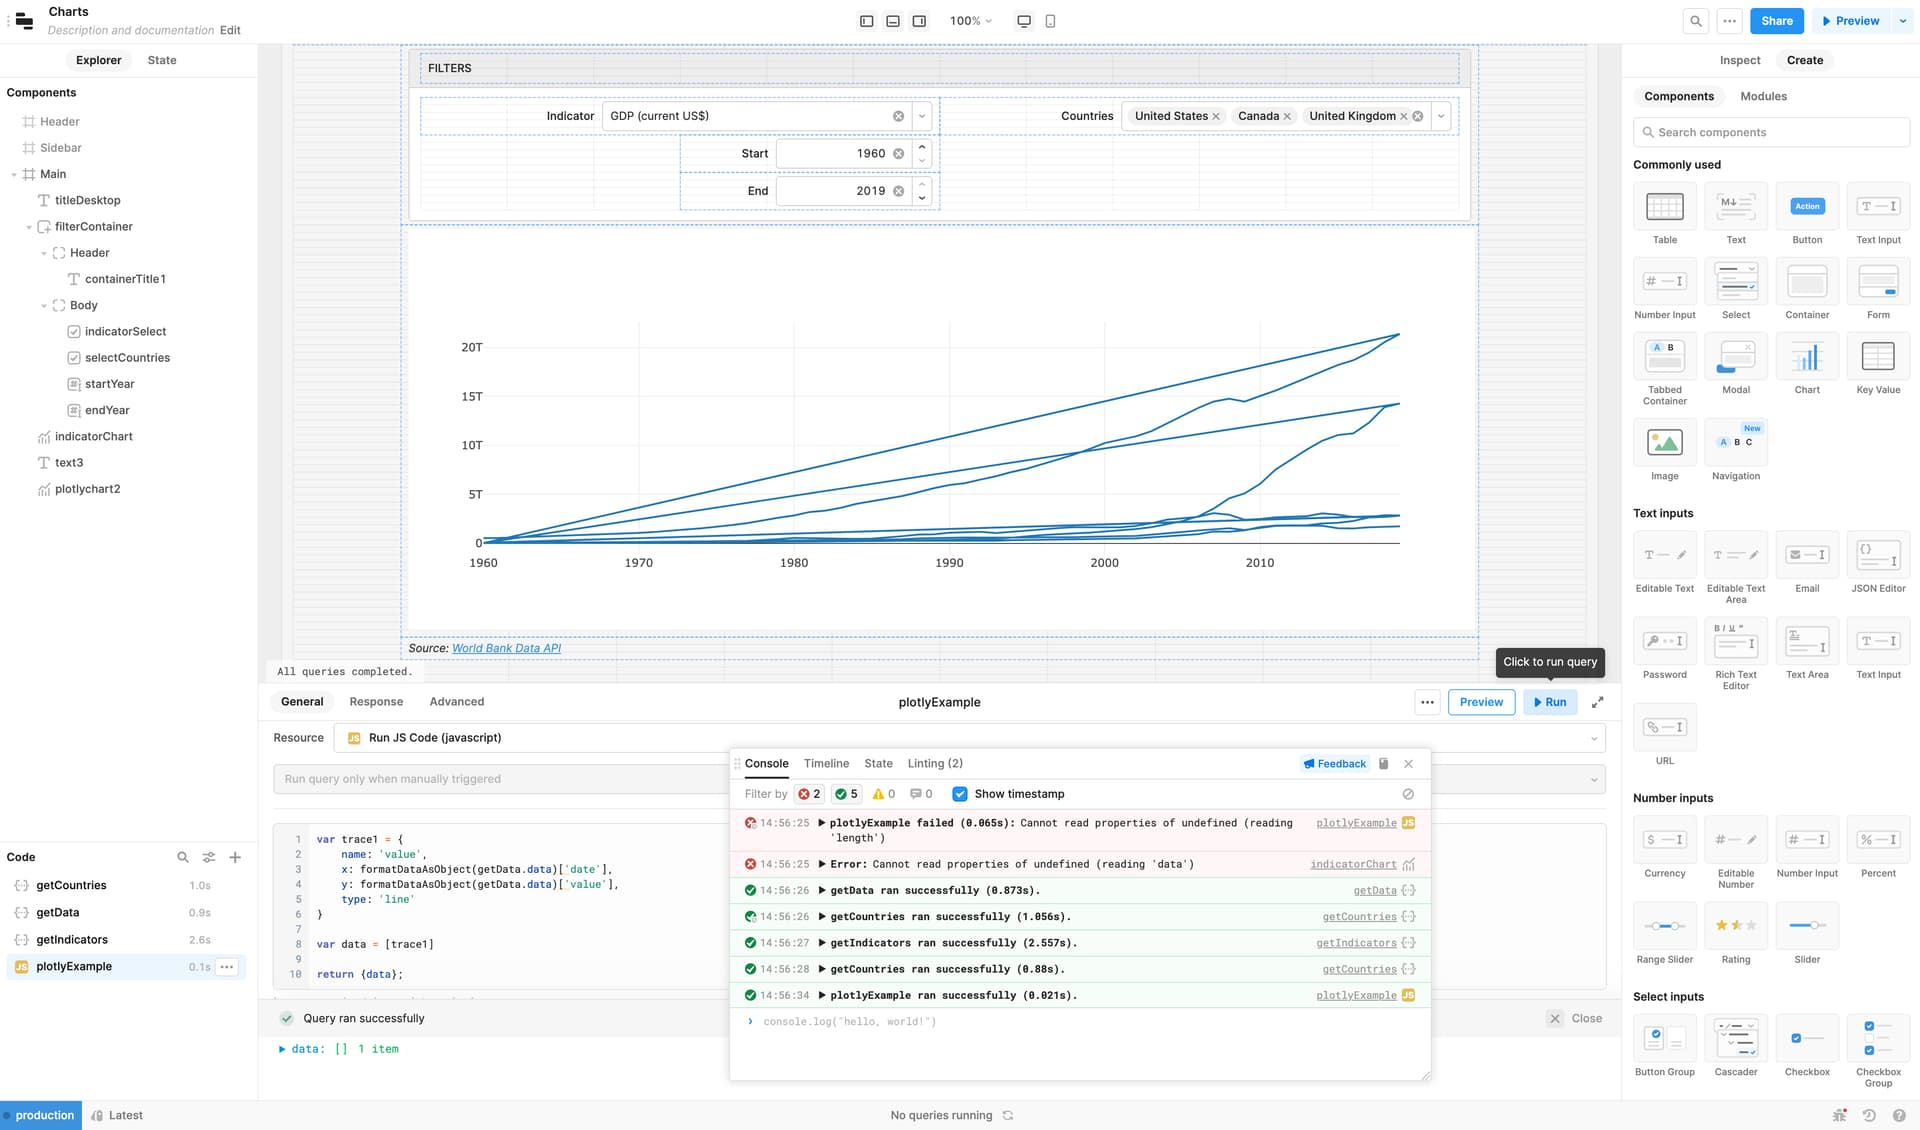
Run the query and you're done! The example should display with sample data and all for you to play around with:

Note that this won't work for all examples since some need more that just the data and layout properties to function, but it does work for a good amount of them :slightly_smiling_face:

Bonus
Some examples use the d3 visualization library which can also be imported as a preloaded library in your app using one of the URLs found here. Plotly examples might use older versions. Attached is a slightly more complicated example that uses a temp state to render an example that uses an async d3 function to render a 3d chart!
plotly demo (1).json (13.0 KB)

8 Likes

Hi Kabirdas,

Thank you for the useful tutorial!

However, everything works fine except that my Plotly chart is not loading on a page refresh and it encounters errors for reading the data and layout when I trigger plotlyExample.js then the chart loads as expected.

I have reproduced the error in the Chart template app that uses plotly.js chart and you can see the screenshot below:

The screenshot here is when the page is refreshed and the plotly.js is not loading due to some reading errors.

This is the screenshot if the script is triggered manually and it seems to be working (I have kept very basic code for demo purposes).

I have also tried your plotly demo.json file and experimented with the Temporary state as you have used in the demo app but still the plotly chart cannot be laoded on a page refresh and only if manually triggered.

I would really appreciate if you can advise if there is an alternative so I don't go back to the manually entering data and layout for the plotly chart which is more inconvenient.

Thank you in advance.

1 Like

Hey @miro_stk, sorry, I missed this post!

It looks like you're running into a bit of a race condition where the JavaScript query executes before your get queries have finished running so there's no data to read.

You might try adding something like the following to the top of your JavaScript query:

const countries = await getCountries.trigger();
const data = await getData.trigger();
const indicators = await getIndicators.trigger();

Then you can reference countries, data, and indicators further on in your plotly script wherever you'd like.

Let me know if that works!