bg1900
August 4, 2023, 11:16pm
1
Hi all,
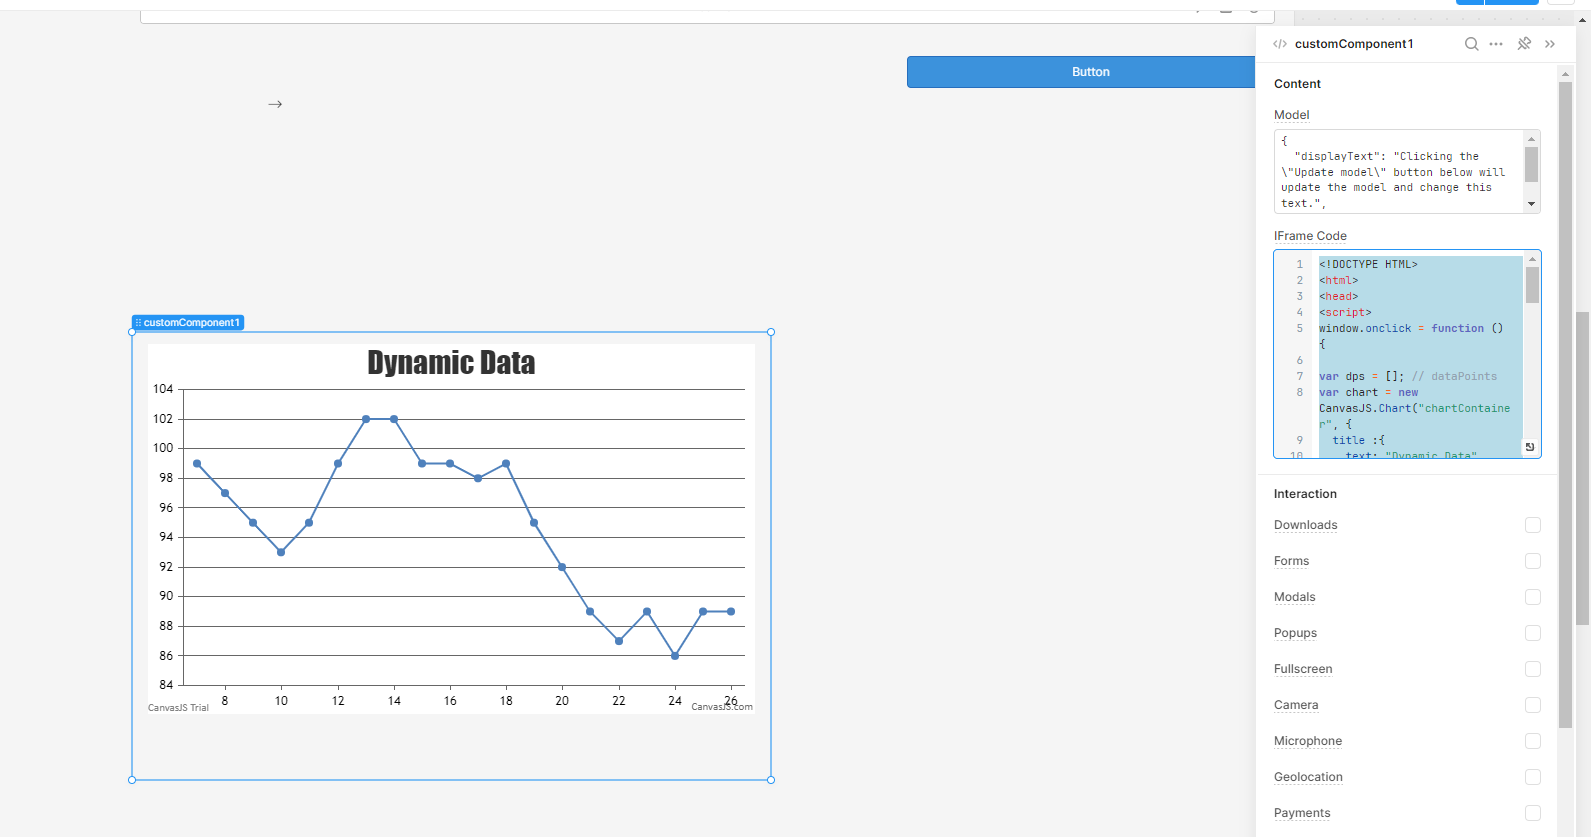
I am trying to get this chart animation to work in a custom component in retool, but for the life of me I cannot get it to load. It just shows a blank screen.
JavaScript Dynamic / Real-Time Charts & Graphs. Dynamically load Chart Data & show changes over time. Supports Live Update of line, area, bar, etc
I tried using retool.subscribe but with no luck.
Any suggestions or ideas welcome
window.Retool.subscribe(function(model) {
////from CHARTupdateChart(dataLength);
var dps = []; // dataPoints
var chart = new CanvasJS.Chart("chartContainer", {
var xVal = 0;
var updateChart = function (count) {
count = count || 1;
for (var j = 0; j < count; j++) {
if (dps.length > dataLength) {
chart.render();
updateChart(dataLength);
})


</script>

<script>

</script>
it work for me.
just modify window.onload to window.onclick, you can't listen to the document load event in custom component.
<!DOCTYPE HTML>
<html>
<head>
<script>
window.onclick = function () {

var dps = []; // dataPoints
var chart = new CanvasJS.Chart("chartContainer", {
  title :{
    text: "Dynamic Data"
  },
  data: [{
    type: "line",
    dataPoints: dps
  }]
});

var xVal = 0;
var yVal = 100;
var updateInterval = 1000;
var dataLength = 20; // number of dataPoints visible at any point

var updateChart = function (count) {

  count = count || 1;

  for (var j = 0; j < count; j++) {
    yVal = yVal +  Math.round(5 + Math.random() *(-5-5));
    dps.push({
      x: xVal,
      y: yVal
    });
    xVal++;
  }

  if (dps.length > dataLength) {
    dps.shift();
  }

  chart.render();
};

updateChart(dataLength);
setInterval(function(){updateChart()}, updateInterval);

}
</script>
</head>
<body>
<div id="chartContainer" style="height: 370px; width:100%;"></div>
<script src="https://cdn.canvasjs.com/canvasjs.min.js"></script>
</body>
</html>
or if you don't want to use click event.window.onload= function () {}
<!DOCTYPE HTML>
<html>
<head>

</head>
<body>
<div id="chartContainer" style="height: 370px; width:100%;"></div>
<script src="https://cdn.canvasjs.com/canvasjs.min.js"></script>
</body>
  <script>


var dps = []; // dataPoints
var chart = new CanvasJS.Chart("chartContainer", {
  title :{
    text: "Dynamic Data"
  },
  data: [{
    type: "line",
    dataPoints: dps
  }]
});

var xVal = 0;
var yVal = 100;
var updateInterval = 1000;
var dataLength = 20; // number of dataPoints visible at any point

var updateChart = function (count) {

  count = count || 1;

  for (var j = 0; j < count; j++) {
    yVal = yVal +  Math.round(5 + Math.random() *(-5-5));
    dps.push({
      x: xVal,
      y: yVal
    });
    xVal++;
  }

  if (dps.length > dataLength) {
    dps.shift();
  }

  chart.render();
};

updateChart(dataLength);
setInterval(function(){updateChart()}, updateInterval);


</script>
</html>
bg1900
August 5, 2023, 1:10pm
4
Thanks AnsonHwang , that works perfectly! You're a lifesaver
alex-w
August 14, 2023, 11:39pm
5
3 posts were split to a new topic: Animated Chart in Retool