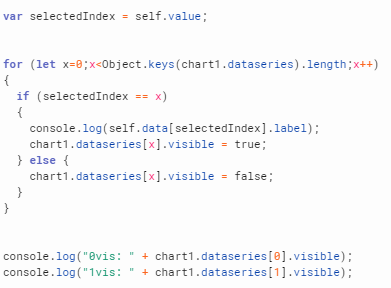
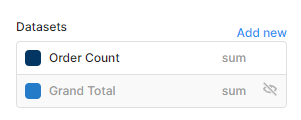
I am trying to have the Change event handler show/hide them with this code but it's not working.. I feel like I'm missing something simple.
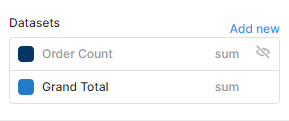
and indeed the logging shows things are being set correct but the chart doesnt change. When I manually show/hide from the chart properties (below) it gives the expected result. any ideas?
Whenever you reference a component in a script it's actually just a copy of the component object so setting properties with something like chart1.dataseries[x].visible = false won't actually change the component, it can only be done if there's a specific set API on the component for that property.
Unfortunately, there isn't one for the visibility of a dataseries, but it is possible to modify the chart's JSON in a transformer before passing it to the component and it only requires some slight modifications to your script.
Something like this!
var dataseries = [/* the JSON for your chart data here */]
var selectedIndex = {{ select1.value }};

for (let x = 0; x < Object.keys(dataseries).length; x++) {
  if (selectedIndex == x) {
    console.log({{ select1.selectedItem.label }});
    dataseries[x].visible = true;
  }
  else {
    dataseries[x].visible = false;
  }
}

console.log("evis: " + dataseries[0].visible);
console.log("lvis: " + dataseries[1].visible);

return dataseries;
Instead of referencing chart1.dataseries you'll want to declare a new dataseries variable that holds the value currently in the Plotly JSON field of your chart data, you'll also want to return that dataseries at the end so it can be passed to the chart. The end result should look something like this:
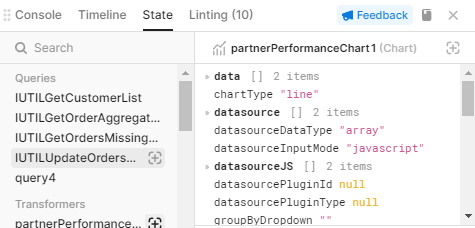
So I've tried to implement this with my chart and datasource. The transformer is spitting out the plotly JSON as in your sample app, the chart is showing the visible dataset but the select does not get populated.
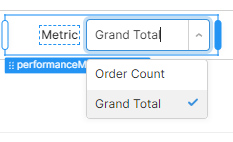
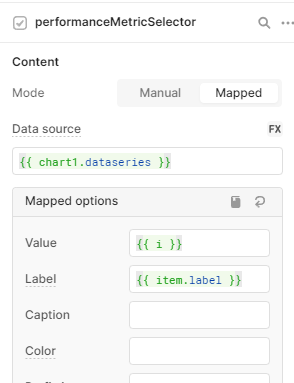
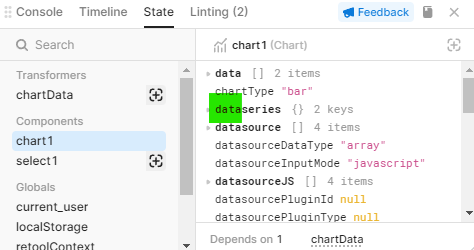
Your datasource for the select is chart1.dataseries:
dataseries is undefined for my chart:
I'm not sure what I'm missing but have been trying to figure it out. Any insight would be much appreciated!
Hi @Kabirdas, I am using 2.119.0. The chart is not new but I will test recreating it from scratch. It was previously using a psql query as it's direct datasource. This query is now called in the transformer. This is the only difference I can see -- your sample app was all static data. Are you able to step in to the app? Thank you!