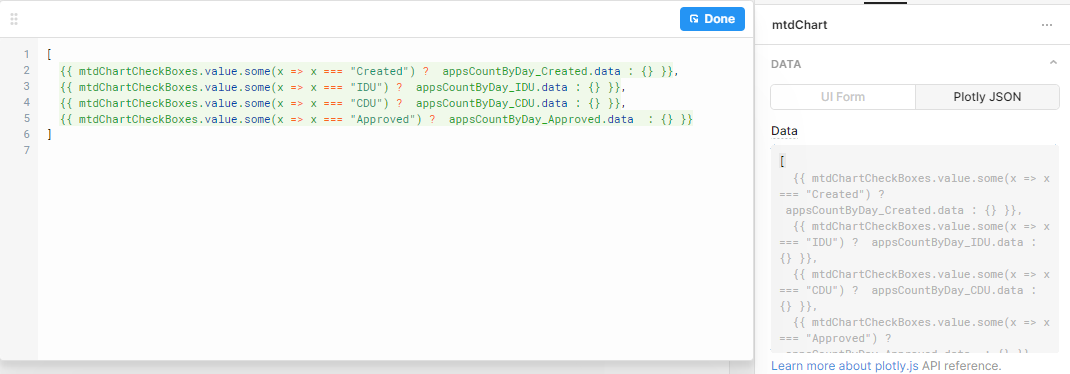
I want to dynamically set the JSON for a chart, taking in data from SQL queries.
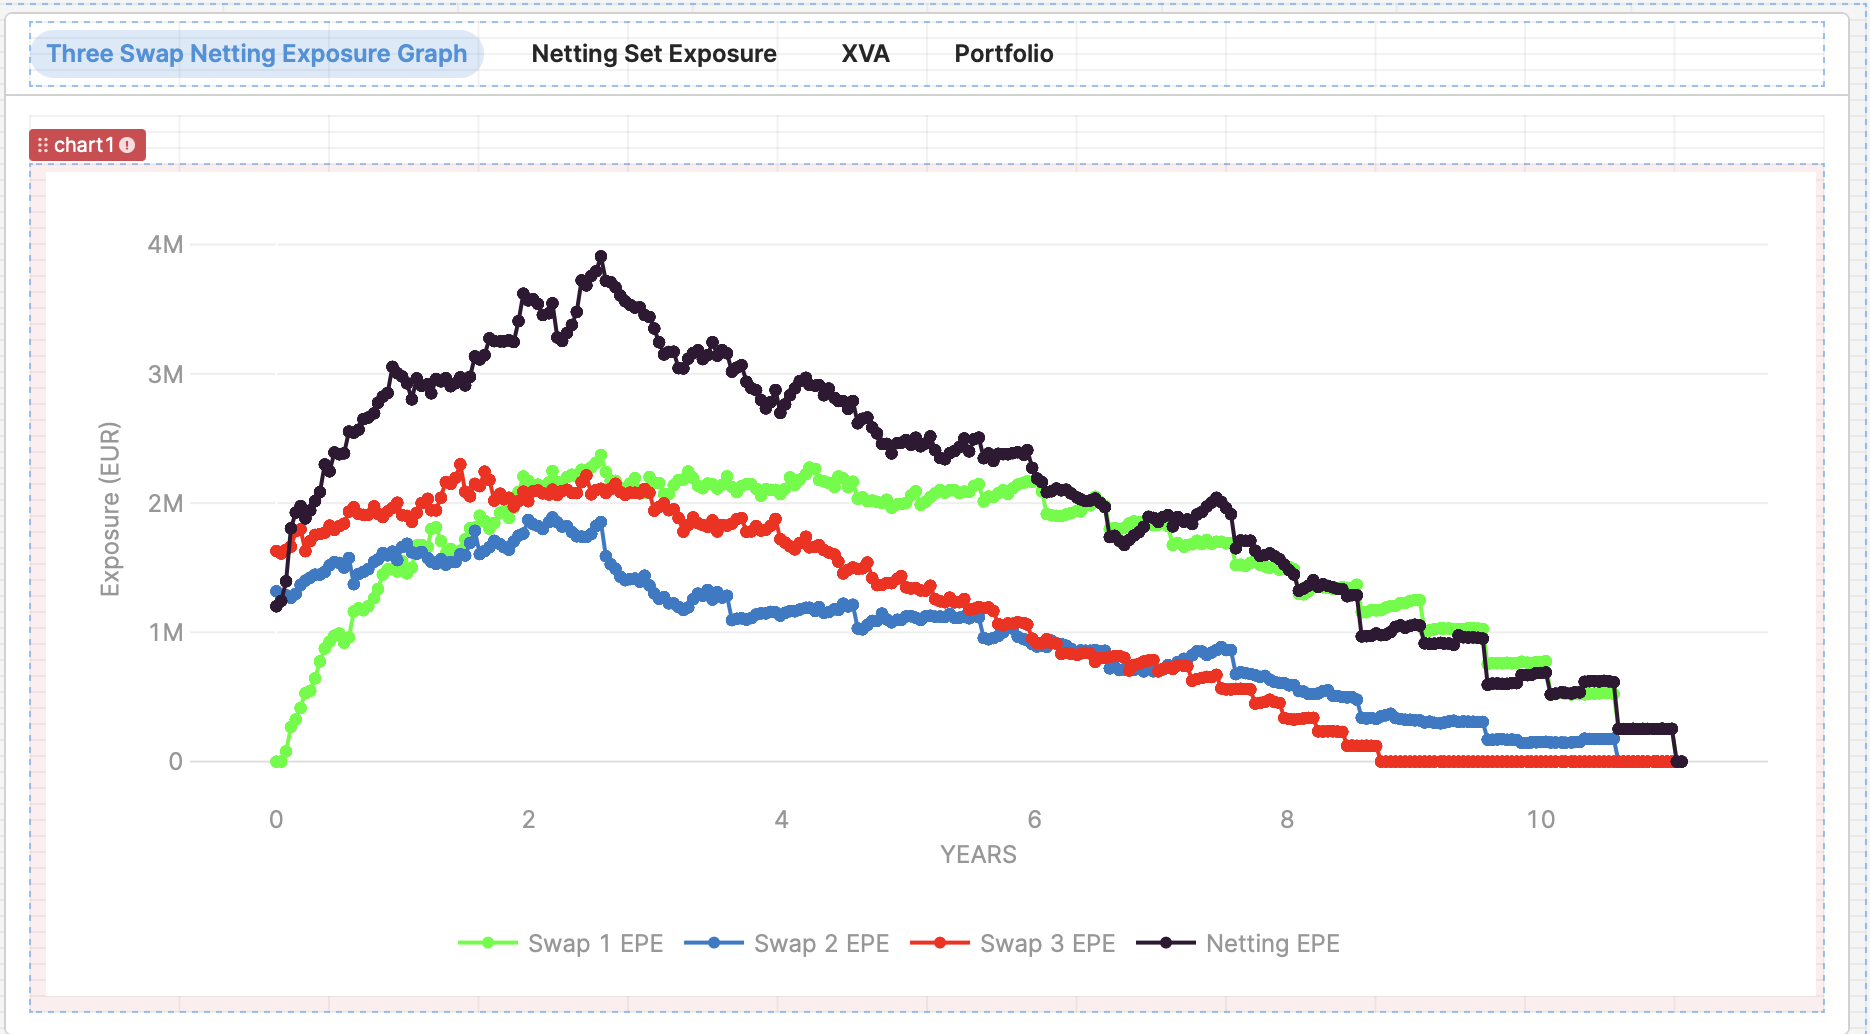
Something like the dummy function below that results in a graph like this:
Any ideas on whether this is possible?
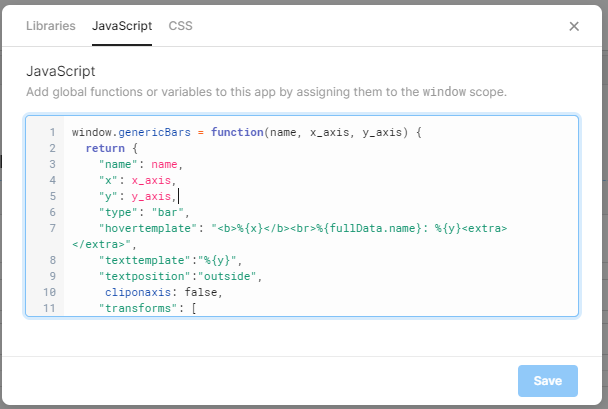
function format_JSON_for_graph(_TradeIdArrayLabel, exampleName) {
const graph_JSON = [];
for (let i = 0; i < _TradeIdArrayLabel.length; i++) {
const graph_item = {
name: _TradeIdArrayLabel[i][0],
x: {{graph_data_example_${exampleName}.data.TIME}},
y: {{graph_data_example_${exampleName}.data['${_TradeIdArrayLabel[i][0]}']}},
type: "line",
hovertemplate: "%{x}
%{fullData.name}: %{y}",
marker: { color: _TradeIdArrayLabel[i][1] },
mode: "lines+markers",
connectgaps: true,
};
graph_JSON.push(graph_item);
}
return JSON.stringify(graph_JSON);
}
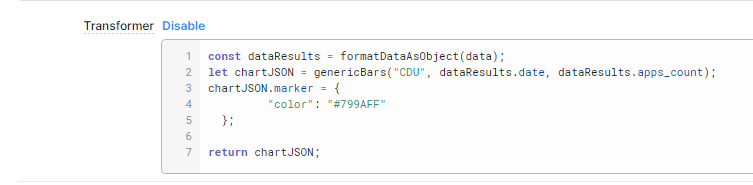
// this data will come from a query
const _TradeIdArrayLabel = [
["Swap_1 EPE", "#00FF00"],
["Swap_2 EPE", "#247BC7"],
["Swap_3 EPE", "#FF0000"],
["Netting EPE", "#301934"],
];
return format_JSON_for_graph(_TradeIdArrayLabel, "10_1_collateral_none");