How can I build stacked bar chart and rotate x axis labels vertically with build-in bar chat?
I'd like to use build-in componets as much as possible. Thanks.
Hi Daiki!
I needed the same type of visualization last week! The built-in bar chart doesn't currently support stacking or rotating the x-axis but I was able to build a simple custom component that uses chart.js, the same charting library the built in component uses, to produce attached chart. I've included code below. Once you've got it figured out it's pretty cool b/c you can use all the features of chart.js in the MODEL field and don't need to touch the IFRAME CODE field.
Hope this helps! Let me know if you have any questions.

Custom Component Code
MODEL field:
{ type: "horizontalBar",
  options: {
  responsive: true,
    stacked: true,
  maintainAspectRatio: false,
  title: {text: "sample horizontal stacked",display: true},
    tooltips: {mode: "index", intersect: true},
  legend: {position: "bottom"},
     scales: {
            xAxes: [{
                stacked: true
            }],
            yAxes: [{
                stacked: true
            }]

        }},
    data: {
    labels: {{query1.data.period}},
      datasets: [
    { label: "type A", data: {{query1.data.type_a}}, backgroundColor: "rgb(231,95,112)"},
    { label: "type B", data: {{query1.data.type_b}}, backgroundColor: "rgb(230,171,2)"},
    { label: "type C", data:{{query1.data.type_c}},        backgroundColor: "rgb(56,108,176)"},
    { label:"type D", data:{{query1.data.type_d}},        backgroundColor: "rgb(77,77,77)"}
    ] }}
IFRAME CODE field:
<html>
<style>
body {
    margin: 0;
}
</style>
<script src="https://www.chartjs.org/dist/2.8.0/Chart.min.js"></script>
<script src="https://www.chartjs.org/samples/latest/utils.js"></script>
<script>
window.Retool.subscribe(function(model) {
    if (!model) { return }
    model.options.tooltips['callbacks'] = {
        footer: function(tooltipItems, data) {
            var sum = 0;
            tooltipItems.forEach(function(tooltipItem) {
                sum += data.datasets[tooltipItem.datasetIndex].data[tooltipItem.index];
            });
            return sum;
        }
    };
    var chartData = model.data;
    var ctx = document.getElementById('canvas').getContext('2d');
    if (!window.myMixedChart) {
        window.myMixedChart = new Chart(ctx, model);
    } else {
        window.myMixedChart.data = model.data;
        window.myMixedChart.options = model.options;
        window.myMixedChart.update();
    }
})
</script>
<div class="chart-container" style="position: relative;margin: auto; height:100vh; width:100vw;">
    <canvas id="canvas"></canvas>
</div>
</body>
</html>
1 Like
Thank you, Jane : )
@jane Thank you so much for posting this! In the example chart, what would the data returned by query1 look like? I’m unclear on how to index my query’s return data by bar label, e.g. something like
{ label: "type A", data: {{query1.data[labels[current_bar_label]].type_a}}, backgroundColor: "rgb(231,95,112)"},
Hi Isaac! To specifically answer your question, the data here is looking for an array of values as an input. There are a few ways to grab that depending on your data structure, which might be different that jane's object of arrays above. I talk a bit about that type of transformation here: How to prefill the content of dropdown from a query? - #6 by alex-w
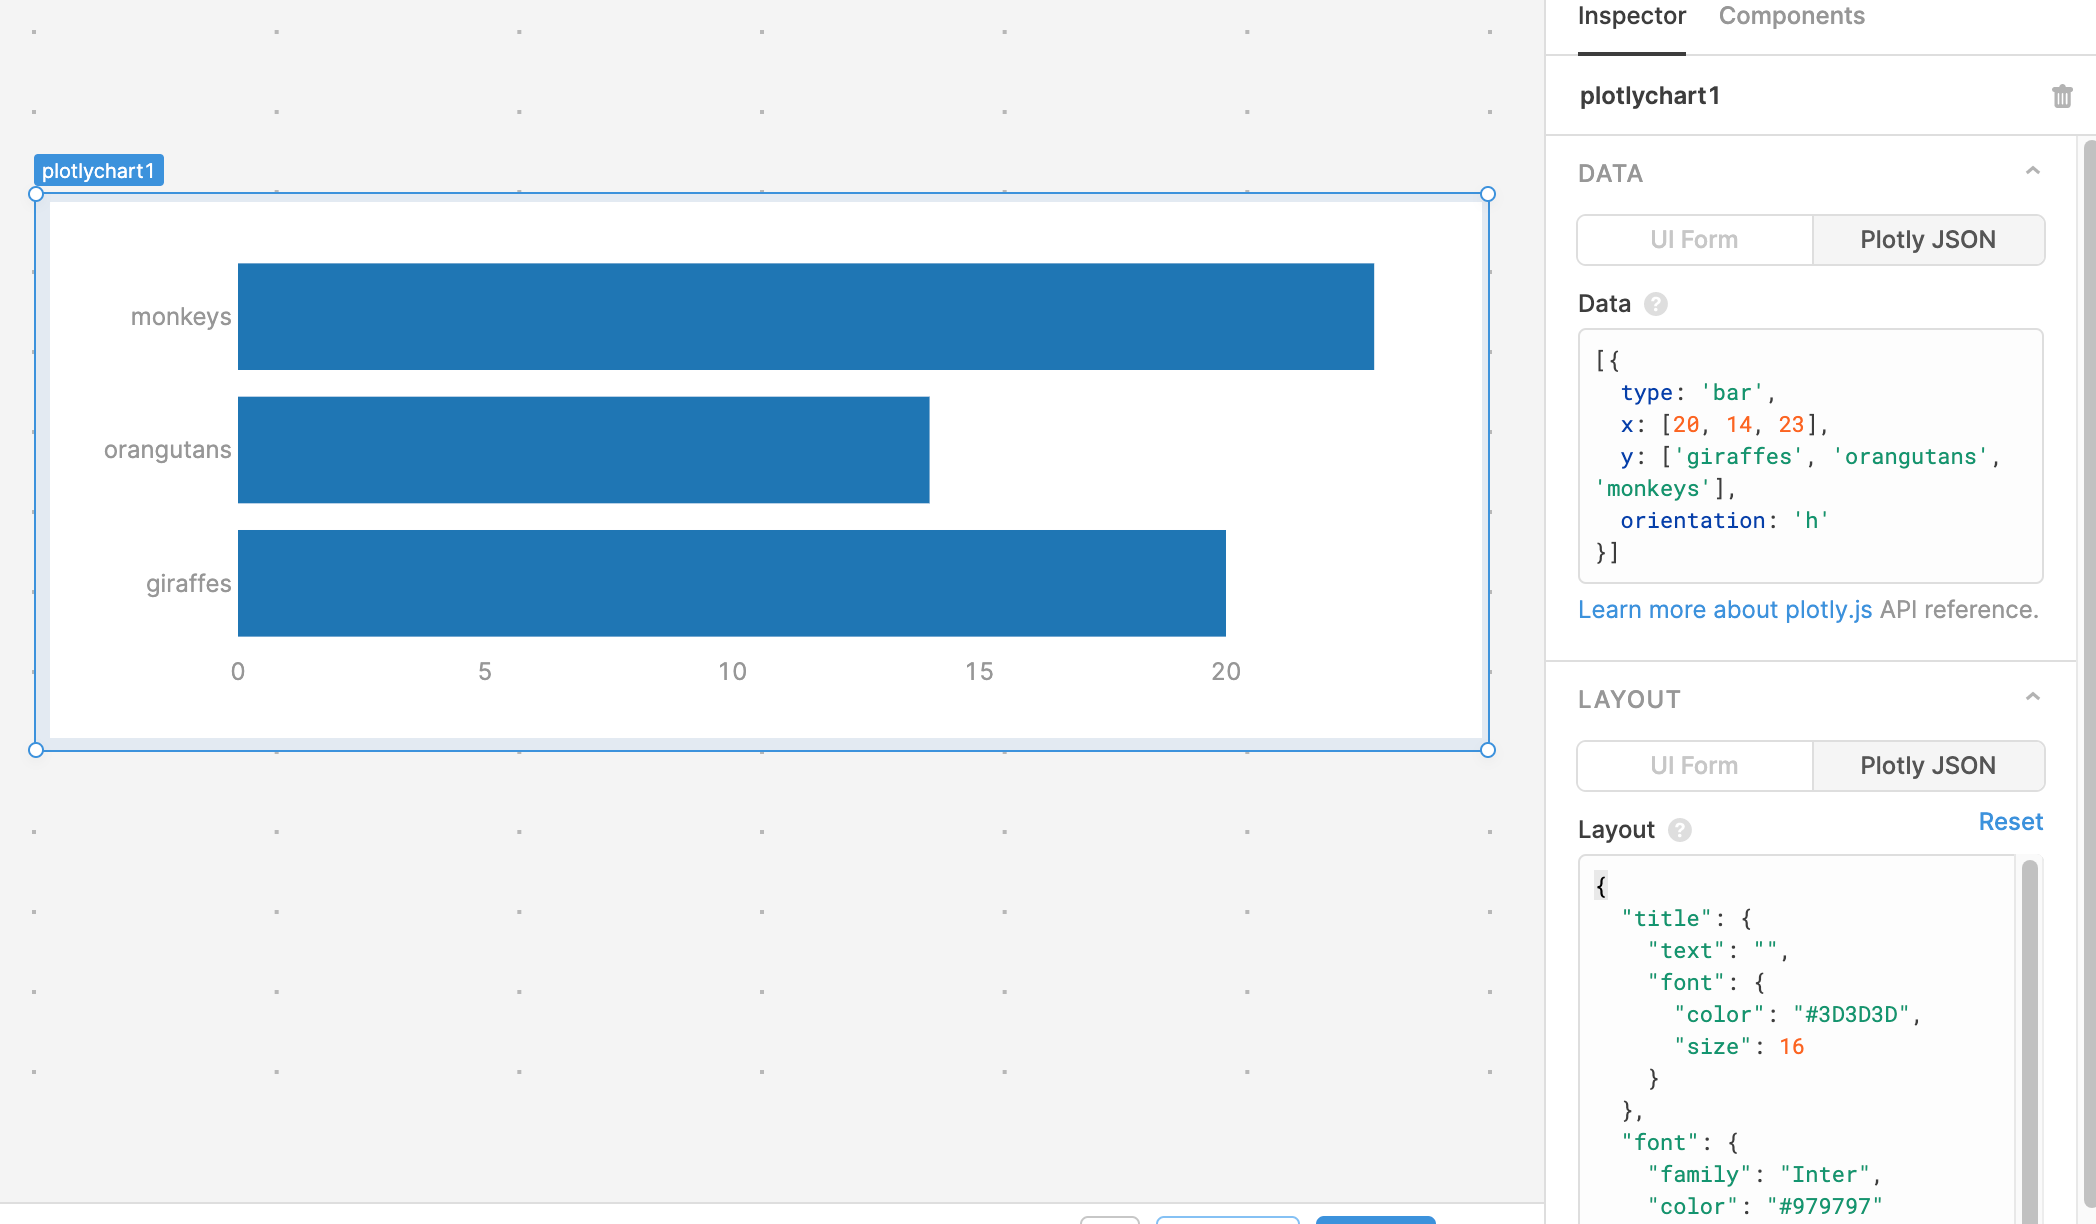
The easiest way to accomplish this thread as a whole is actually using our new Plotly component now- you can switch it over to using raw Plotly JSON as your input.
Here is a JSON export example of the basic example that Plotly has on their docs
4 Likes
Hi folks!
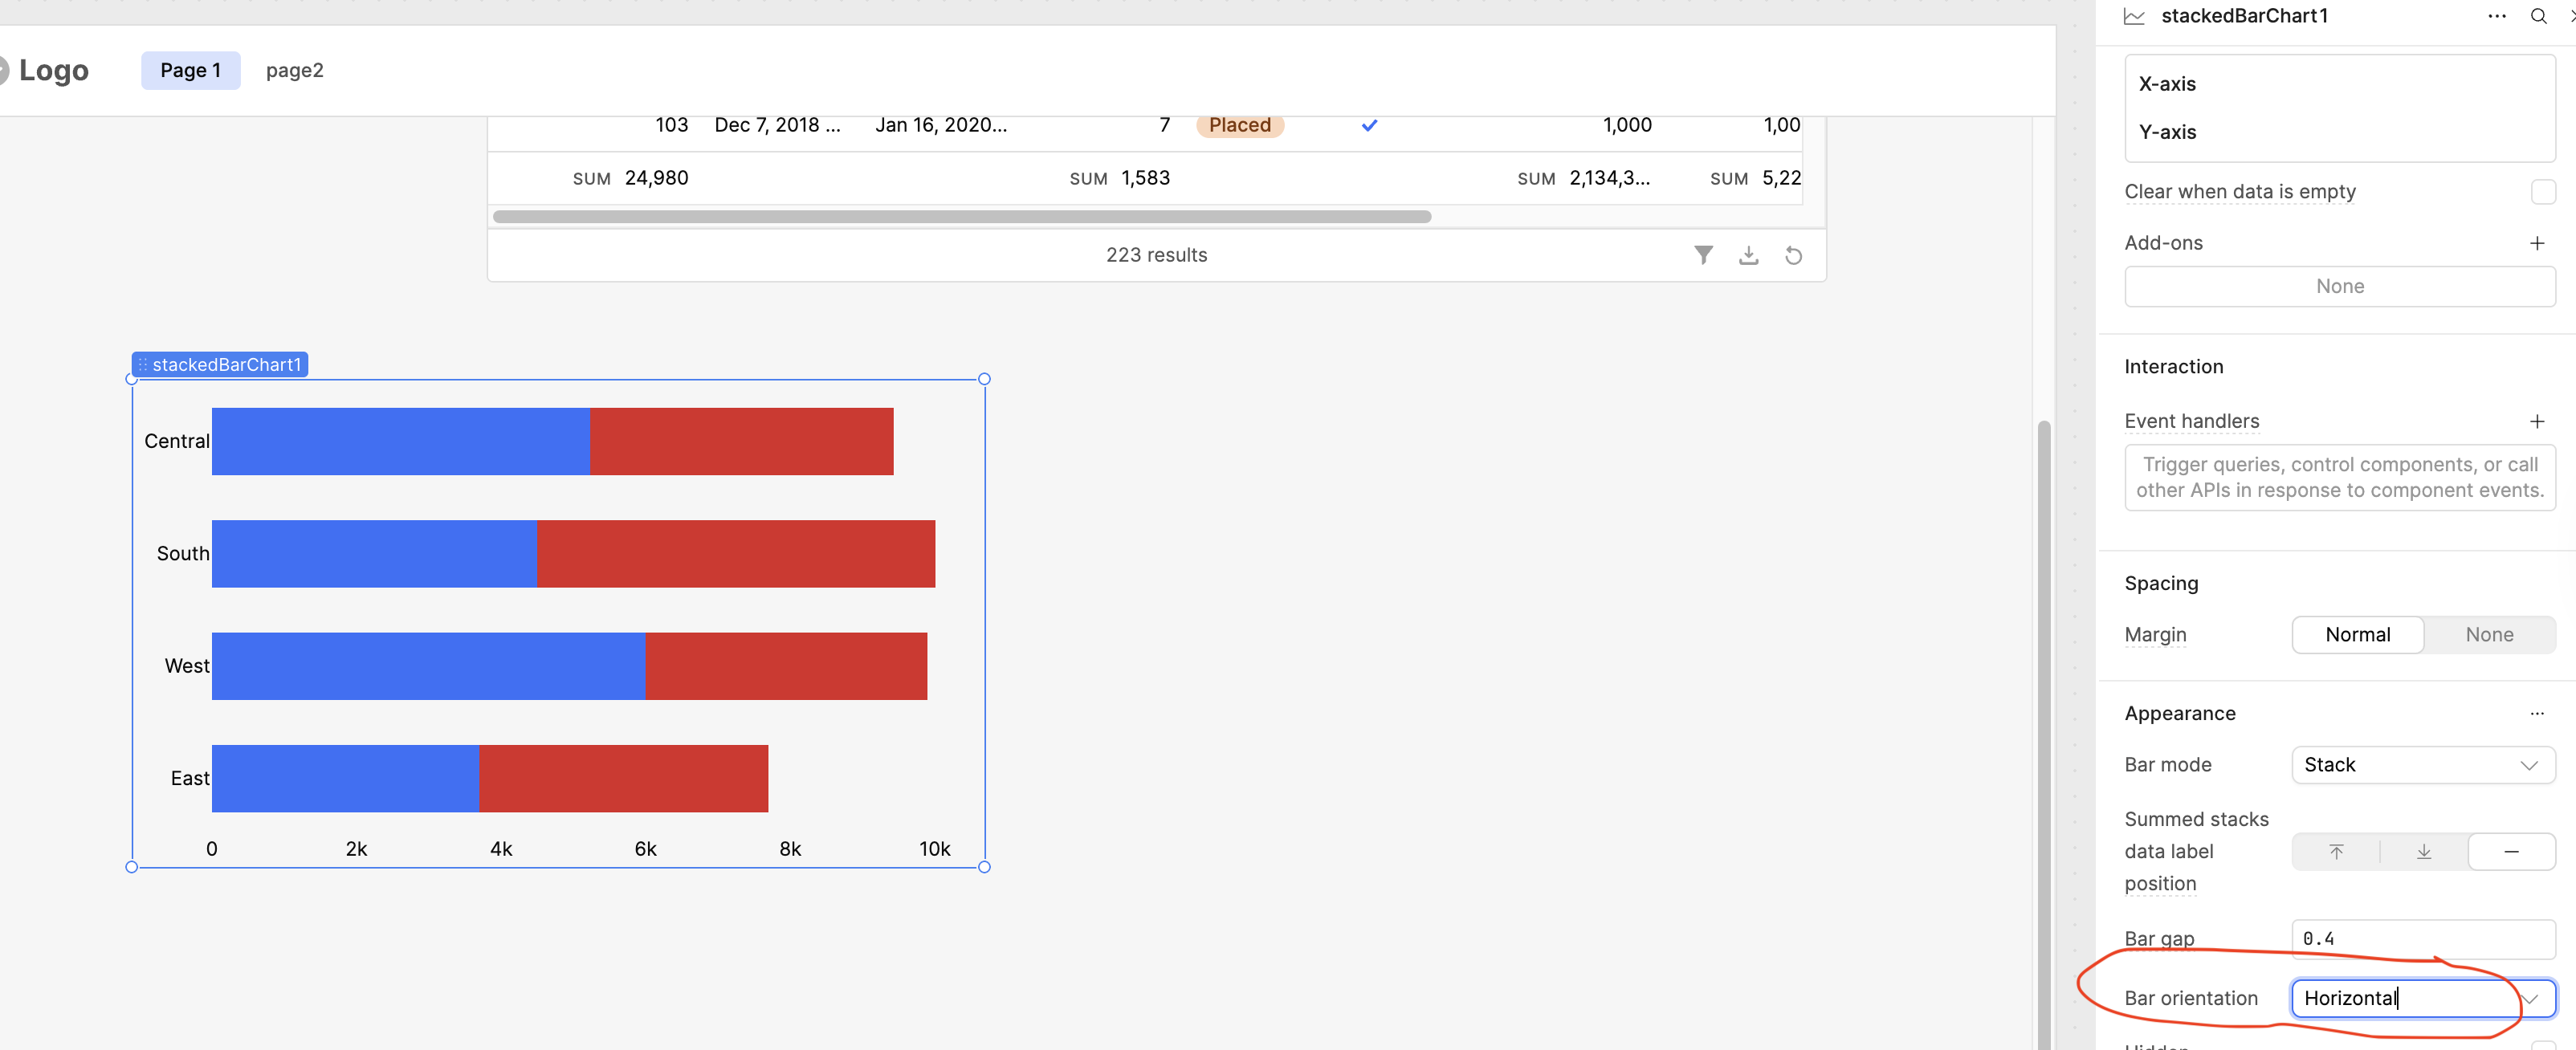
The previous solution is a little outdated as we have moved from a Plotly chart component to several unique bar chart components.
We have one dedicated to stacked bar charts, which can be found in the component library.
In order to rotate the bar orientation, there is a drop down in the component's inspector under the 'Bar Orientation' input field.