How to highlight a marker when clicked on a line chart

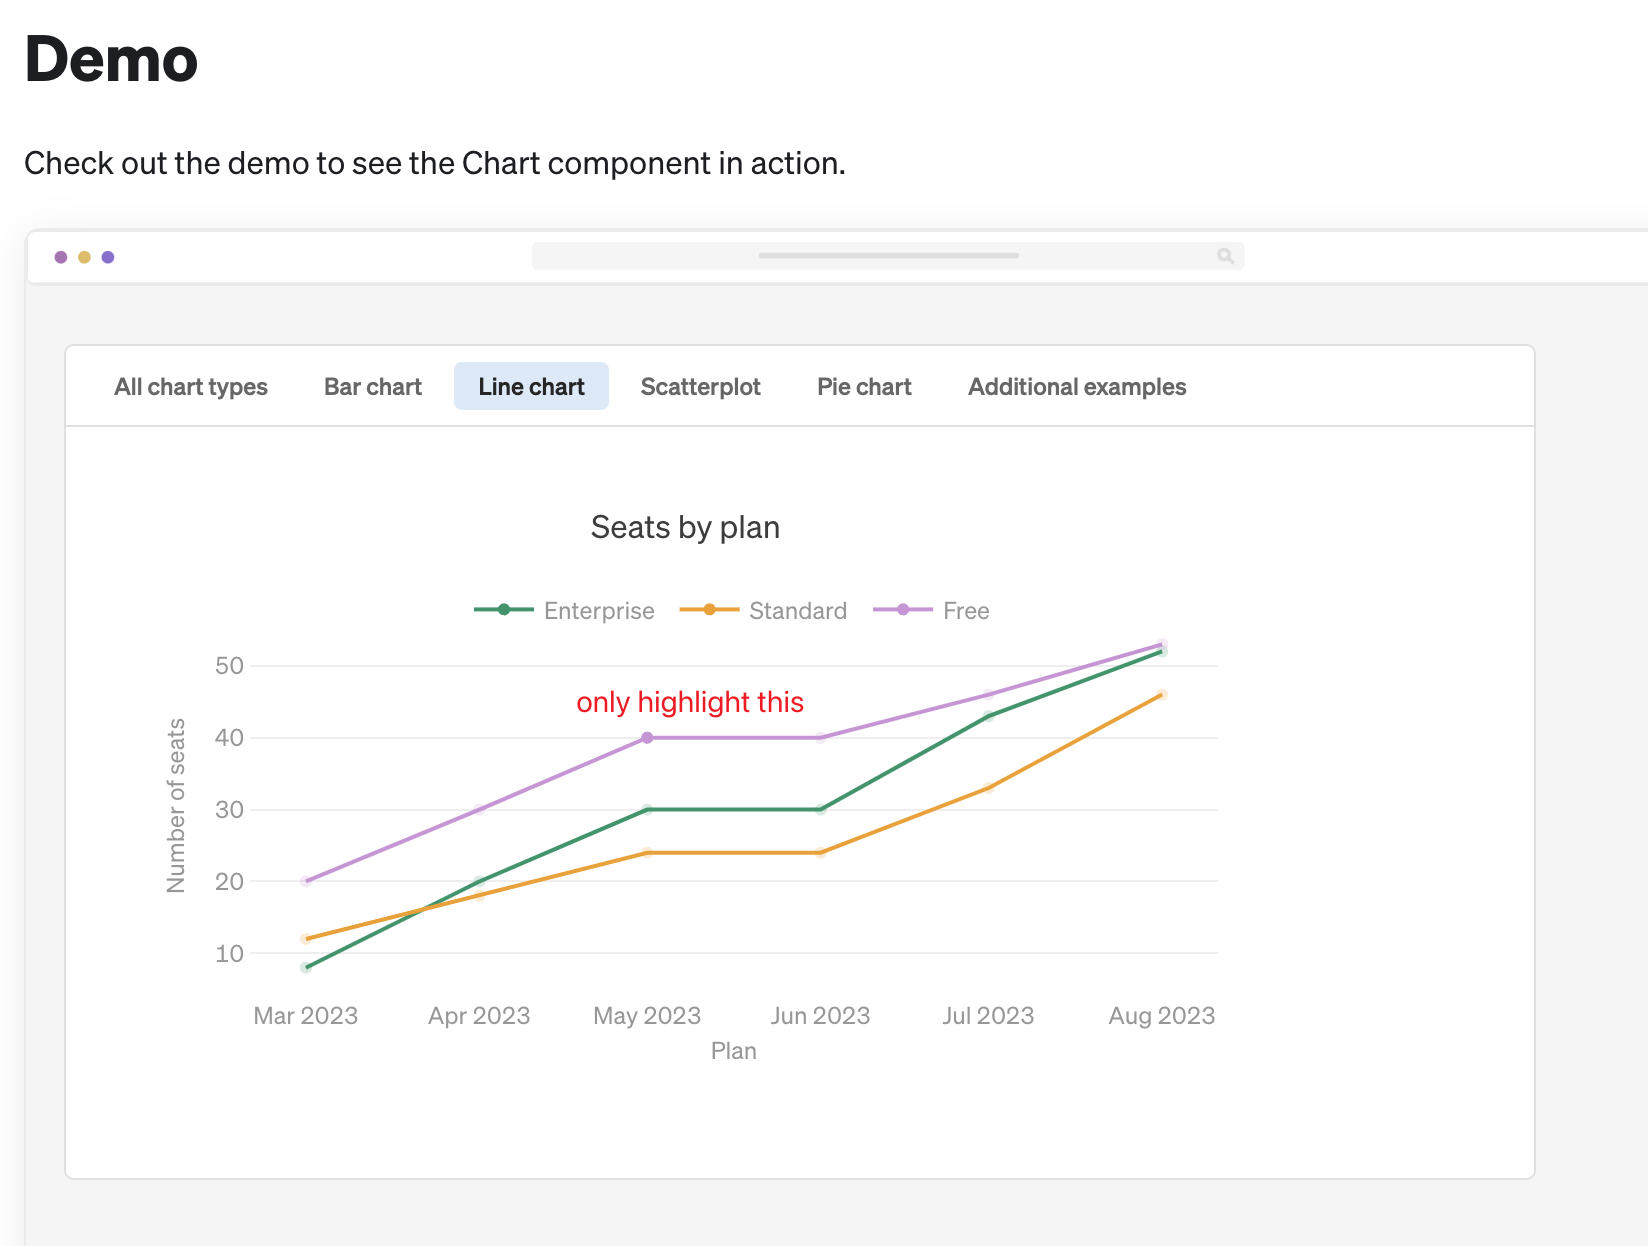
  • Goal: I want to achieve an effect similar to the line chart in the demo (Visualize data with the Chart component | Retool Docs) , where the selected marker is highlighted after clicking.

  • Steps:

  • Details:
    I have search all documents and try to ask chatGPT, they tell me using the Plotly.restyle. I cannot reference the Plotly in the Run Script handler.

  • Screenshots:

Hi @ll000.zhang - welcome to the forums. I've found the best place to start with charts is this excellent tutorial post Quickly implementing PlotlyJS examples with Chart from @Kabirdas. The overall trick is that you need to create a JavaScript Query that generates the Plotly JSON for the layout.

Give it a shot and let us know if you get stuck along the way. Happy building!

2 Likes

Hi @ll000.zhang,

Are you still working on this?

My issue has been resolved, thank you.

1 Like