Hello there,
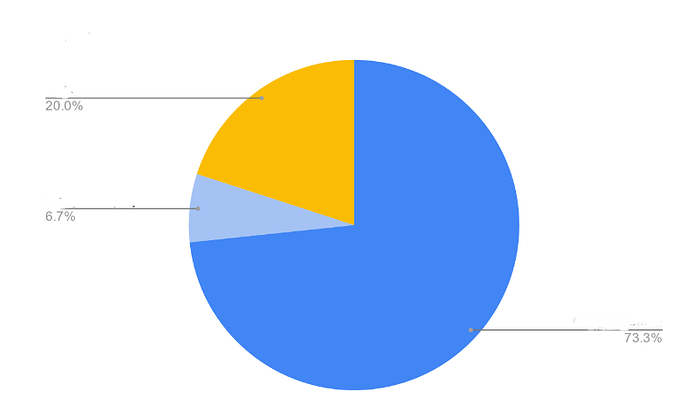
I'm trying to modify the pie chart, is it possible to modify the json of the chart to reach that?
Hi @stokoljasivan, welcome to the Retool forums.
For your pie chart, I'd recommend a great @Kabirdas thread on customizing charts: Quickly implementing PlotlyJS examples with Chart
Based on that post, see if you can find what you are looking for here...
...and then you can get into further details of the layout options here:
I think you need the property textposition: "outside" in the data object (and probably showlegend: false in the layout object).
Happy building!
Thanks @jg80 , it worked!
