Goal: Have Grouped Bar Chart but each bar is stacked. I Only see the option to do Grouped or stacked but i am looking to do a combination of both
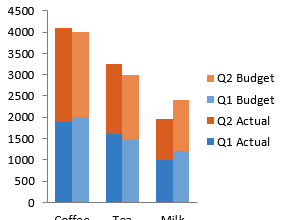
Example:
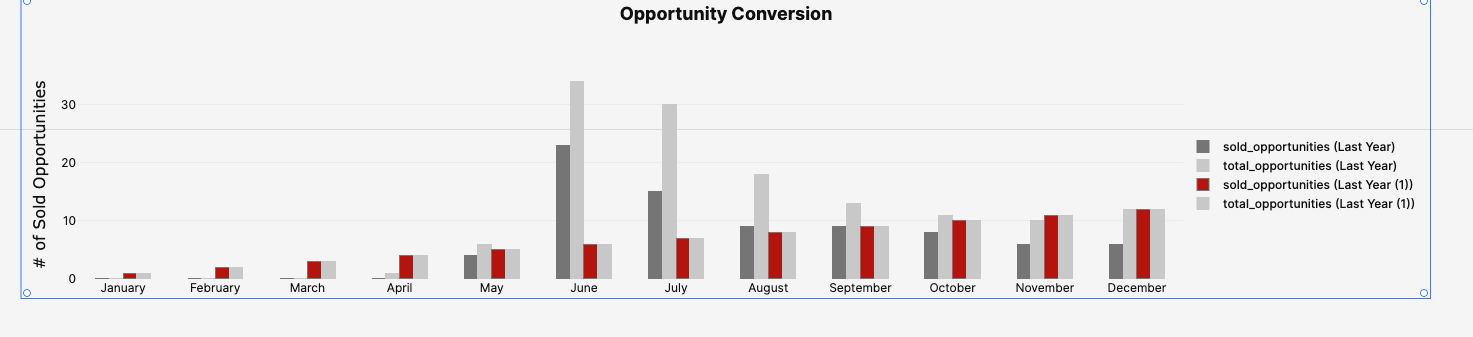
For my Data one bar is Last year and one bar is this year. but the stacked portion of the bar should be possible sales leads and the lower filled portion the amount of sold sales leads
if i choose grouped i have 4 bars next to each other. If i choose stacked i have them all stacked on one. I am looking for 2 Stacked Bar graphs that are stacked bar Graphs.
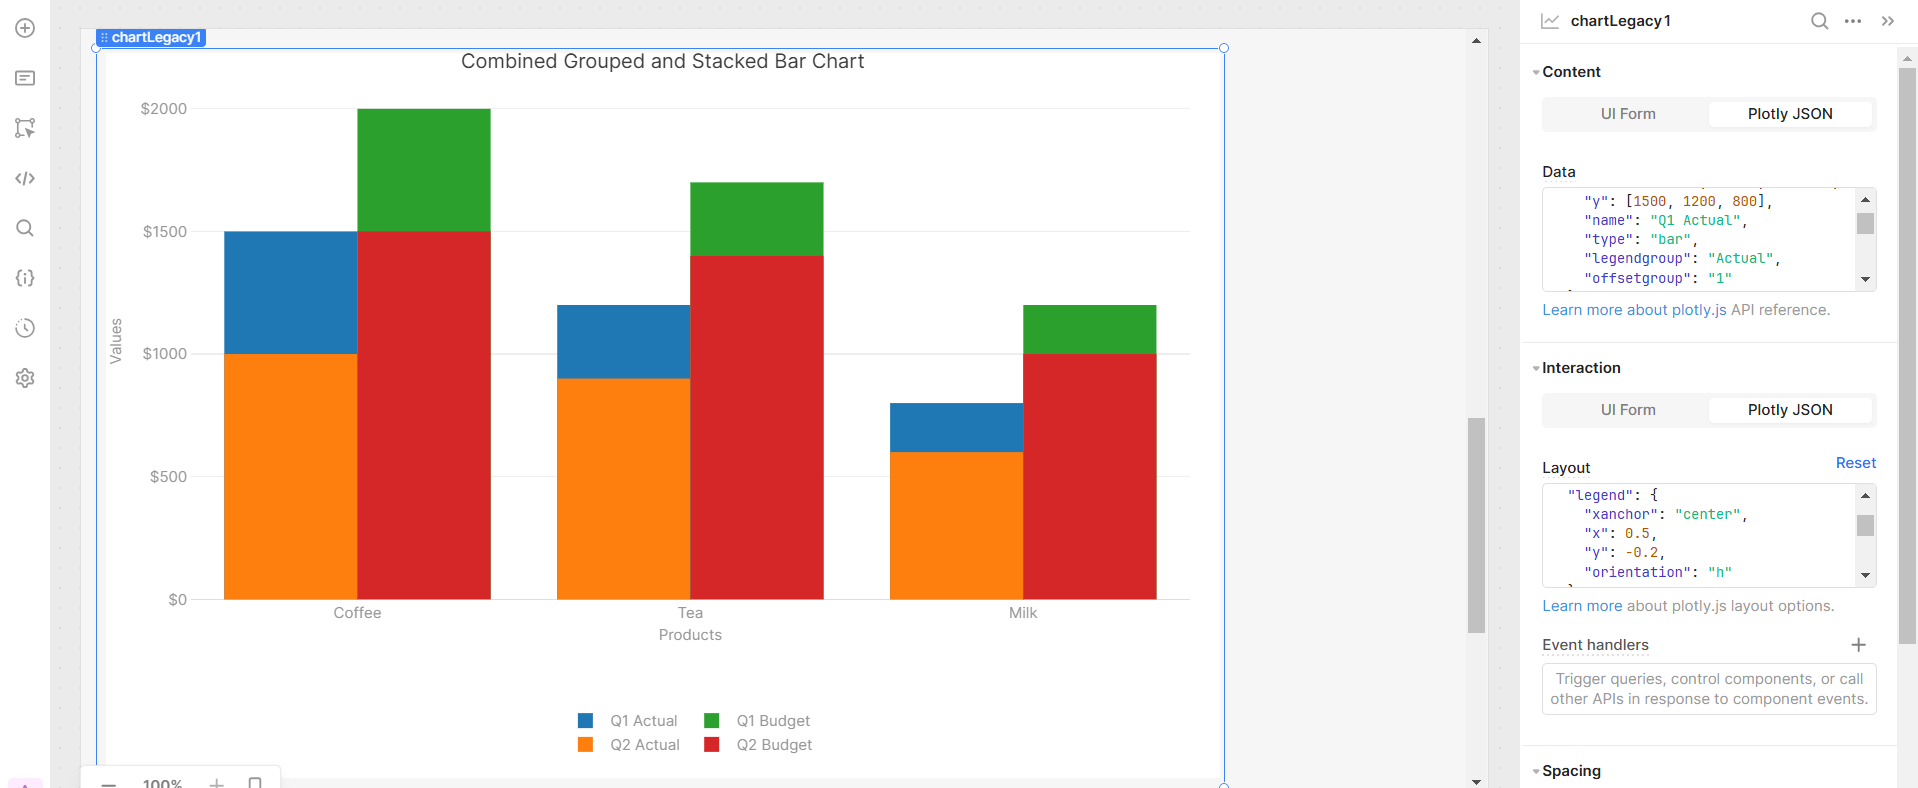
Is there a way to do it or do i need to use the Plotly Json chart and custom make it?
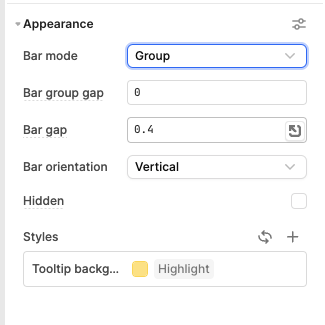
Yes, it is possible to create a grouped stacked bar chart using Plotly's JSON chart configuration. You can use the showlegend and legend in layout. showlegend is to determines whether the legend is displayed and legend Customizes the position and orientation. The layout specifies axis labels, margins, and legend positioning, with barmode: 'relative' enabling the stacking of bars.
Yes, i will probably end up using that. I was checking to see if there was a way without using the Plotly Json. So just using the UI Form. I will go about it that way. Thanks!
I'd expect this use case to need the custom plotly json Hope you've sorted this out already, but if not, could you share the sample data structure for your query?
@WidleStudioLLP Your's looks good.
I thought I'd be able to do it but i'm struggling to get it to work. Would you mind sharing this example data and layout values?