Hi all! New to Retool and the community so forgive me for such a basic question.
Goal: I need colors to be consistent across charts.
Details: I have a dashboard that I recently built to assist in reporting various metrics. I have set the colors of the charts for one customer but when I select a different customer, the colors in the charts will reset to random colors even though it's the same exact data being shown. Ideally, I could somehow hardcode these colors so no matter the customer that is chosen, the charts will be consistent to keep with our branding. For example, Value A will always be 335AF1, Value B will always be A8F4FF, etc.
I appreciate the help and happy to share screenshots if needed!
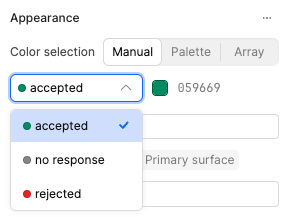
Without seeing your exact setup, I suspect this is due to something I encountered recently when attempting to use a "Manual" Color selection method: the underlying data-source object passed into the chart with labels and values fields likely has inconsistent ordering, despite being otherwise consistent from entry to entry.
I solved this using a Javascript Map object to power my chart's labels & values, as it guarantees key order. This StackOverflow answer helped put me on the right path.
While this worked, it would be nice if Retool offered a simpler way to map the same keys/labels to the same colors consistently instead of it being a toss-up based on key ordering.
@kjosephsmith,
It looks like you are missing data in your values and your labels fields. Take a look at this simple app I have built as an example ( you can create my app from the attached json). So each of the 3 fields: values, labels and array for the Colors Selection should all have an array of the same length. This length will be equal to the number of slices in your pie chart.
I'm a little unclear on what it is you want to show in your pie chart. Will it be the 53 reasons? (53 slices?) What is the value of each reasons (what percentage of the pie chart)? I don't have the raw data from your databases, so I can't really tell what it is you are trying to display.
In my pie chart example, I am showing, from my table of 100 users, what percentage of them are Viewers versus Editors versus Admin. So just 3 slices.
Thank you! I was able to get the pie chart fixed in my app so the colors seem to stick when switching customers.
The pie chart shows the percentage of reasons for a given time frame for a given customer, so despite the database having a total of 53 distinct reasons, a customer will usually only have 7-10 distinct reasons, so the chart would have a slice representing each reasons with the percentage.
Would it be the same method for a stacked bar chart? Define the values, labels, and any group by criteria in a javascript, then map everything accordingly to the chart component? Thank you again- so much- for the help!
Click on each one of these "Viewer", "Editor" and "Admin" in the inspector for the barChart to see how they are set up. You essentially have to set up each different color in the stack as its own data series, and assign one color to it in its own configuration.
Let me know if you have any questions about how to set it up.
Thank you, Linda! I am not sure if this would work in for my use case now that I have been messing with it this evening.
When an account rep uses this dashboard, they will first select their customer from a dropdown and then choose a date range. From there, a query triggers and populates two things- a reasons dropdown and a table component. The reasons dropdown only shows the ones that are used by the selected customer, which is just a handful of the 53 distinct reasons found in the database. As reasons are checked in the multi-select dropdown, the table updates along with all of the charts to show a visual of alerts for that customer. Some charts update based on other single or multi-select components.
The stacked bar charts (all 12 of them) are pretty detailed and need to be grouped by various categories (facility, building, floor, unit, area, month, day of week, time of day, etc...). This is used as our company's primary reporting tool for customer performance and utilization, which is why there is so much needed detail on these charts.
In the example you provided- with each role being mapped- I would essentially have to map all 53 reasons as it's own data series in the chart, and then create the array of whatever the grouping would be, and as the table component is updated (based on the customer, date range, and reasons dropdown), the charts would reflect that?
@kjosephsmith,
I believe if you write a query that returns the specific data, the series for that specific customer should auto populate, but I will test this and get back to you.
@kjosephsmith,
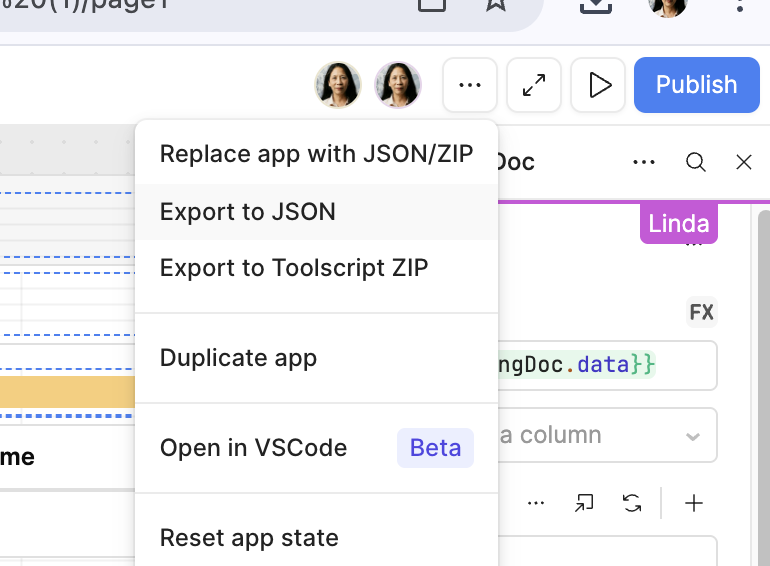
With the new stacked bar component, you have to enter each of the 53 reasons separately. However, you can use the Plotly JSON chart. I will upload an app with a demonstration momentarily...