Alright, I had to give it another shot 
Plotly supports navigation too. So, instead of horizontal scrolling, you could use the plotly pan feature insted. Does this work for you?
Here's the layout JSON:
{
  dragmode: 'pan', // enables panning
  xaxis: {
    range: [0, 3] // sets "zoom" factor
  },
  yaxis: {
    fixedrange: true, // prevents vertical panning
  },
  margin: {
    l: 20,
    r: 20,
    b: 20,
    t: 20,
    pad: 4
  }
}
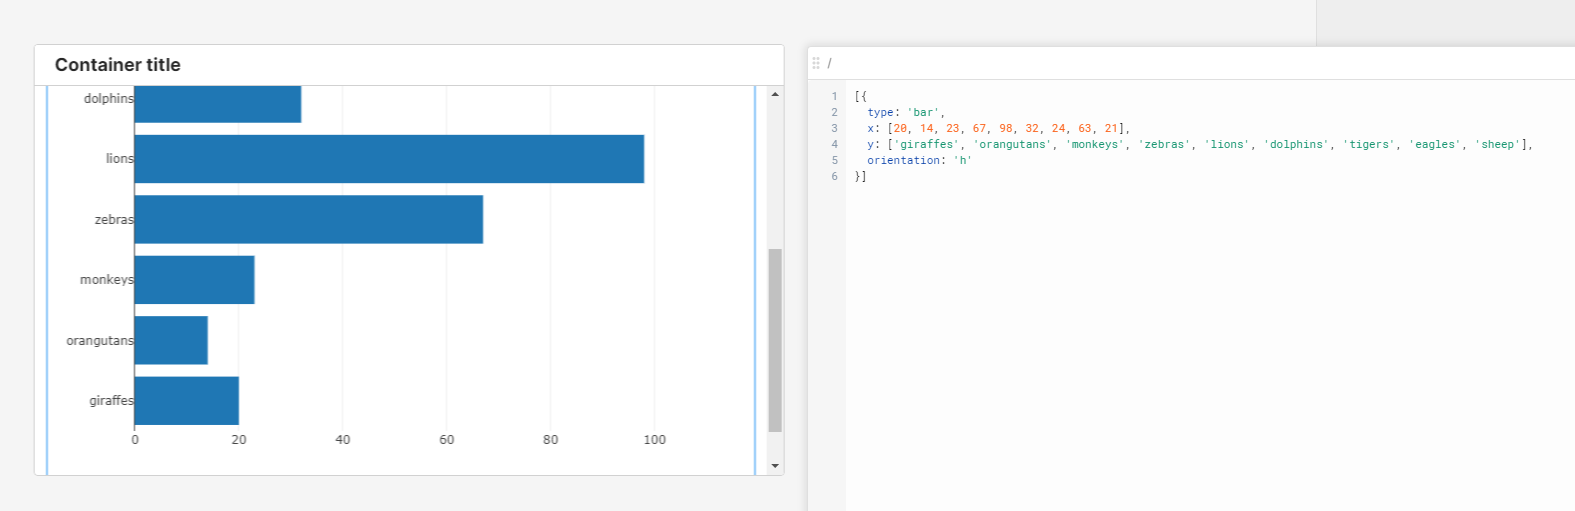
And the data JSON I used in the example:
[
  {
    x: ['Apples', 'Oranges', 'Watermelon', 'Pears', 'Apples1', 'Oranges1', 'Watermelon1', 'Pears1', 'Apples2', 'Oranges2', 'Watermelon2', 'Pears2', 'Apples3', 'Oranges3', 'Watermelon3', 'Pears3','Apples4', 'Oranges4', 'Watermelon4', 'Pears4'],
    y: [3, 2, 1, 4, 3, 2, 1, 4, 3, 2, 1, 4, 3, 2, 1, 4, 3, 2, 1, 4],
    type: 'bar'
  }
]
EDIT: Commented the JSON example for better understanding what each setting stands for
EDIT 2: Added the data JSON, just in case someone needs it