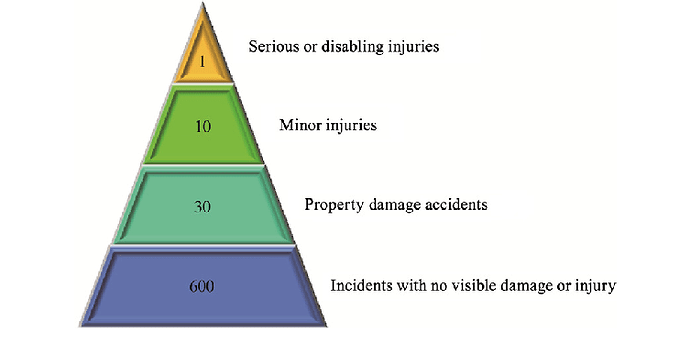
Hello there,
I use Retool to create dashboards, which are then made available to clients via another ReactJS application
And I need to create, for a particular use case, a Pyramid chart like this, with data from an SQL query
The closest I've found is the "funnel" type provided on Plotly, but several things don't fit with it (eg the size of the different regions, the fact that a funnel is by definition upside down etc. .)
Do you have any possible solutions to do this?
I found a way that would be to use something like chartJS, is it maybe possible to import it?
Thanks !
Hello @FlorianRuen
you can surely do it in a Custom Component.
There's an example that uses ChartJs at the bottom of this doc page:
https://docs.retool.com/docs/custom-components
Hope this help.
1 Like
Thanks, I will get a look into the custom components 
@abusedmedia
I tried to use CanvaJS to create a beautiful pyramid chart, it works on JSFiddle, but when I adapt the code to works with Retool Custom Component, nothing appear
You can see the JSFiddle just here : Setting Minimum Height (minHeight) for columns in Column Chart - CanvasJS JavaScript Charts - JSFiddle - Code Playground
something wrong here ?
<html>
  <head>
    <script src="https://canvasjs.com/assets/script/canvasjs.min.js"></script>
    <script>
      window.Retool.subscribe(function(model) {

        var minValue = 500;
        var ctx = document.getElementById('canvas').getContext('2d');

        var chartData = [{
          type: "pyramid",
          toolTipContent: "{y}",
          indexLabelFontColor: "#fff",
          indexLabelFontSize: 16,
          indexLabel: "{y}",
          indexLabelPlacement: "inside",
          dataPoints: [
            { y: 625, indexLabel: 'label1', color: 'red', indexLabelFontColor: 'red' },
            { y: 16, indexLabel: 'label2', color: 'blue', indexLabelFontColor: 'blue'},
            { y: 8, indexLabel: 'label3', color: 'yellow', indexLabelFontColor: 'yellow'},
            { y: 3, indexLabel: 'label4', color: 'black', indexLabelFontColor: 'black'}
          ]
        }];

        var chart = new CanvasJS.Chart("chartContainer", data : { chartData });
        chart.render();
    })
    </script>
  </head>

  <body>
    <div id="chartContainer" style="height: 360px; width: 100%;"></div>
  </body>
</html>
Thanks for your help on this subject !
Just tried to paste the whole JSFiddle javascript code within the Retool.subscribe function and it works. Your code has some issue, then.
I also tried the same : just pasting the JSFiddle js and adding Retool.subscribe, doesn't appear
Can you paste the code you have in iFrame custom component ? Strange behavior on my side
This is what I paste in the IFrame panel:
<html>
  <head>
    <script src="https://canvasjs.com/assets/script/canvasjs.min.js"></script>
    <script>
      window.Retool.subscribe(function(model) {

        var minValue = 500;

var chart = new CanvasJS.Chart("chartContainer", {
  axisX: {
    interval: 1
  },
  data: [
  {
    type: "pyramid",
    toolTipContent: "{y}",
    indexLabelFontColor: "#fff",
    indexLabelFontSize: 16,
    indexLabel: "{y}",
    indexLabelPlacement: "inside",
    axisX: {
      labelAngle: -30
    },
    dataPoints: [
      { x: 'aa', y: 625, indexLabel: 'aa', label: 'aa' },
      { x: 'bb', y: 16, indexLabel: 'bb', label: 'bb'},
      { x: 'cc', y: 8, indexLabel: 'cc', label: 'cc'},
      { x: 'dd', y: 3, indexLabel: 'dd', label: 'dd'}
    ]
  }
  ]
});
setMinValue();
chart.render();

function setMinValue() {
  var data = chart.options.data;
  for(var i = 0; i < data.length; i++) {
    for(var j =0; j < data[i].dataPoints.length; j++) {
    var yValue = data[i].dataPoints[j].y;
      if(yValue <= minValue && yValue >= -minValue) {
        data[i].dataPoints[j].y = yValue < 0 ? -minValue : minValue;
        data[i].dataPoints[j].toolTipContent = ("{x}: " + yValue);
        data[i].dataPoints[j].indexLabel = ("" + yValue);
      }
    }
  }
}
    })
    </script>
  </head>

  <body>
    <div id="chartContainer" style="height: 360px; width: 100%;"></div>
  </body>
</html>
