Hi all,
Does anyone know if it possible to import LIghteningChart's libraries into Retool?
Their libraries seem very fast! At least compared to the animations speeds that can be done with plotly that I've found
Hi all,
Does anyone know if it possible to import LIghteningChart's libraries into Retool?
Their libraries seem very fast! At least compared to the animations speeds that can be done with plotly that I've found
If you want to use lightningChart, you may use Custom Coponent instead of chart component.
If this is what you want?
You can past following code to Iframe of custom component to test it.
<html>
  <head>
  </head>
  <body>
    <div id="lightningChart"></div>

  </body>
  <script src="https://cdn.jsdelivr.net/npm/@arction/lcjs@4.0.2/dist/lcjs.iife.js"></script>

  <script>

  const { lightningChart } = lcjs;
  const chart = lightningChart().ChartXY(document.getElementById("lightningChart"));
  chart
    .addLineSeries({ dataPattern: { pattern: "ProgressiveX" } })
    .add(dataSet); // { x: number, y: number }[]
  </script>
</html>
yes that is the sort of thing! Though with some data in it ![]()
I am really trying to see if I can get this example JS working in a retool custom component:
Hello.
Here is the code
<html>
  <head>
  </head>
  <body>
    <div id="lightningChart"></div>

  </body>
  <script src="https://cdn.jsdelivr.net/npm/@arction/lcjs@4.0.2/dist/lcjs.iife.js"></script>

  <script>

const {
    lightningChart,
    AutoCursorModes,
    emptyLine,
    AxisTickStrategies,
    AxisScrollStrategies,
    synchronizeAxisIntervals,
    UIOrigins,
    UIDraggingModes,
    LegendBoxBuilders,
    Themes,
} = lcjs
  const chart = lightningChart().ChartXY(document.getElementById("lightningChart"));
  const SIGNALS = new Array(5).fill(0).map((_, i) => ({
    title: `Ch ${i + 1}`,
}))
const DEFAULT_X_RANGE_MS = 30 * 1000
const PADDING_BOTTOM = 30
const PADDING_TOP = 40
const PADDING_LEFT = 100
const PADDING_AXIS_Y = 6


const exampleContainer = document.getElementById('chart') || document.body

const dashboard = lightningChart()
    .Dashboard({
        numberOfColumns: 1,
        numberOfRows: SIGNALS.length,
        theme: Themes.darkGold,
    })
    .setSplitterStyle(emptyLine)

/**
 * Function updates heights of charts in Dashboard. Should be called on resize/etc. for interactive applications.
 */
const layoutDashboard = () => {
    const totalHeight = exampleContainer.getBoundingClientRect().height
    const signalHeight = (totalHeight - PADDING_BOTTOM - PADDING_TOP) / SIGNALS.length

    SIGNALS.forEach((_, iSignal) => {
        const chHeight = signalHeight + (iSignal === 0 ? PADDING_TOP : 0) + (iSignal === SIGNALS.length - 1 ? PADDING_BOTTOM : 0)
        dashboard.setRowHeight(iSignal, chHeight)
    })
}
requestAnimationFrame(layoutDashboard)

const channels = SIGNALS.map((signal, iSignal) => {
    const chart = dashboard
        .createChartXY({
            columnIndex: 0,
            rowIndex: iSignal,
        })
        .setTitle('')
        .setPadding({
            top: iSignal > 0 ? PADDING_AXIS_Y : 0,
            bottom: iSignal < SIGNALS.length - 1 ? PADDING_AXIS_Y : 0,
            left: 0,
        })
        .setAutoCursorMode(AutoCursorModes.disabled)
        .setBackgroundStrokeStyle(emptyLine)
        .setMouseInteractions(false)

    const axisX = chart
        .getDefaultAxisX()
        .setTickStrategy(AxisTickStrategies.Empty)
        .setStrokeStyle(emptyLine)
        .setScrollStrategy(AxisScrollStrategies.progressive)
        .setInterval({ start: -DEFAULT_X_RANGE_MS, end: 0, stopAxisAfter: false })
    const axisY = chart
        .getDefaultAxisY()
        .setTickStrategy(AxisTickStrategies.Empty)
        .setStrokeStyle(emptyLine)
        .setTitle(signal.title)
        .setTitleRotation(0)
        .setThickness(60)

    const series = chart
        .addLineSeries({
            dataPattern: { pattern: 'ProgressiveX' },
            automaticColorIndex: iSignal,
        })
        .setName(`Channel ${iSignal + 1}`)
        .setDataCleaning({ minDataPointCount: 10000 })
        // Use 2 thickness for smooth anti-aliased thick lines with the best visual look, this is pretty GPU heavy.
        .setStrokeStyle((style) => style.setThickness(2))

    return { chart, series, axisX, axisY }
})
const channelTop = channels[0]
const channelBottom = channels[channels.length - 1]

channelTop.chart.setTitle(`Multi-channel real-time monitoring (${SIGNALS.length} chs, 1000 Hz)`)

const axisX = channelBottom.axisX
    .setThickness(PADDING_BOTTOM)
    .setTickStrategy(AxisTickStrategies.Time, (ticks) =>
        ticks
            .setMajorTickStyle((major) => major.setGridStrokeStyle(emptyLine))
            .setMinorTickStyle((minor) => minor.setGridStrokeStyle(emptyLine)),
    )
synchronizeAxisIntervals(...channels.map((ch) => ch.axisX))

// axisX.setInterval({ start: -DEFAULT_X_RANGE_MS, end: 0, stopAxisAfter: false })

// Add legend
const legend = dashboard
    .addLegendBox(LegendBoxBuilders.HorizontalLegendBox)
    .setPosition({ x: 50, y: 0 })
    .setOrigin(UIOrigins.CenterBottom)
    .setMargin({ bottom: PADDING_BOTTOM })
    .setDraggingMode(UIDraggingModes.notDraggable)
channels.forEach((channel) => legend.add(channel.series))

// Custom interactions for zooming in/out along Time axis while keeping data scrolling.
axisX.setNibInteractionScaleByDragging(false).setNibInteractionScaleByWheeling(false).setAxisInteractionZoomByWheeling(false)
const customZoomX = (_, event) => {
    const interval = axisX.getInterval()
    const range = interval.end - interval.start
    const newRange = range + Math.sign(event.deltaY) * 0.1 * Math.abs(range)
    axisX.setInterval({ start: interval.end - newRange, end: interval.end, stopAxisAfter: false })
    event.preventDefault()
    event.stopPropagation()
}
axisX.onAxisInteractionAreaMouseWheel(customZoomX)
channels.forEach((channel) => {
    channel.chart.onSeriesBackgroundMouseWheel(customZoomX)
    channel.series.onMouseWheel(customZoomX)
})

// Add LCJS user interface button for resetting view.
const buttonReset = dashboard
    .addUIElement()
    .setText('Reset')
    .setPosition({ x: 0, y: 0 })
    .setOrigin(UIOrigins.LeftBottom)
    .setMargin({ left: 4, bottom: 4 })
    .setDraggingMode(UIDraggingModes.notDraggable)
buttonReset.onMouseClick((_) => {
    const xMax = channels[0].series.getXMax()
    axisX.setInterval({ start: xMax - DEFAULT_X_RANGE_MS, end: xMax, stopAxisAfter: false })
    channels.forEach((channel) => channel.axisY.fit())
})

// Generate data sets that is repeated for each channel for demonstration purposes.
const dataSets = [
    { length: Math.ceil(400 * Math.PI), func: (x) => 8 * Math.sin(x / 200) },
    { length: Math.ceil(3200 * Math.PI), func: (x) => 7 * Math.sin(x / 1600) },
    { length: Math.ceil(800 * Math.PI), func: (x) => 4 * (Math.cos(x / 400) + Math.sin(x / 200)) },
    { length: Math.ceil(800 * Math.PI), func: (x) => 6 * Math.sin(x / 100) + Math.cos(x / 400) },
    { length: Math.ceil(1800 * Math.PI), func: (x) => 8 * Math.cos(x / 900) },
].map((config) => {
    const data = []
    data.length = config.length
    for (let i = 0; i < config.length; i += 1) {
        const y = config.func(i)
        data[i] = y
    }
    return data
})

// Stream data into series.
let tStart = window.performance.now()
let pushedDataCount = 0
const dataPointsPerSecond = 1000 // 1000 Hz
const xStep = 1000 / dataPointsPerSecond
const streamData = () => {
    const tNow = window.performance.now()
    // NOTE: This code is for example purposes (streaming stable data rate without destroying browser when switching tabs etc.)
    // In real use cases, data should be pushed in when it comes.
    const shouldBeDataPointsCount = Math.floor((dataPointsPerSecond * (tNow - tStart)) / 1000)
    const newDataPointsCount = Math.min(shouldBeDataPointsCount - pushedDataCount, 1000) // Add max 1000 data points per frame into a series. This prevents massive performance spikes when switching tabs for long times
    const seriesNewDataPoints = []
    for (let iChannel = 0; iChannel < channels.length; iChannel++) {
        const dataSet = dataSets[iChannel % dataSets.length]
        const newDataPoints = []
        for (let iDp = 0; iDp < newDataPointsCount; iDp++) {
            const x = (pushedDataCount + iDp) * xStep
            const iData = (pushedDataCount + iDp) % dataSet.length
            const y = dataSet[iData]
            const point = { x, y }
            newDataPoints.push(point)
        }
        seriesNewDataPoints[iChannel] = newDataPoints
    }
    channels.forEach((channel, iChannel) => channel.series.add(seriesNewDataPoints[iChannel]))
    pushedDataCount += newDataPointsCount
    requestAnimationFrame(streamData)
}
streamData()

// Measure FPS.
let tFpsStart = window.performance.now()
let frames = 0
let fps = 0
const title = channelTop.chart.getTitle()
const recordFrame = () => {
    frames++
    const tNow = window.performance.now()
    fps = 1000 / ((tNow - tFpsStart) / frames)
    requestAnimationFrame(recordFrame)

    channelTop.chart.setTitle(`${title} (FPS: ${fps.toFixed(1)})`)
}
requestAnimationFrame(recordFrame)
setInterval(() => {
    tFpsStart = window.performance.now()
    frames = 0
}, 5000)

  </script>
</html>
This is fantastic. I am super impressed. Thank you so so much for your help!
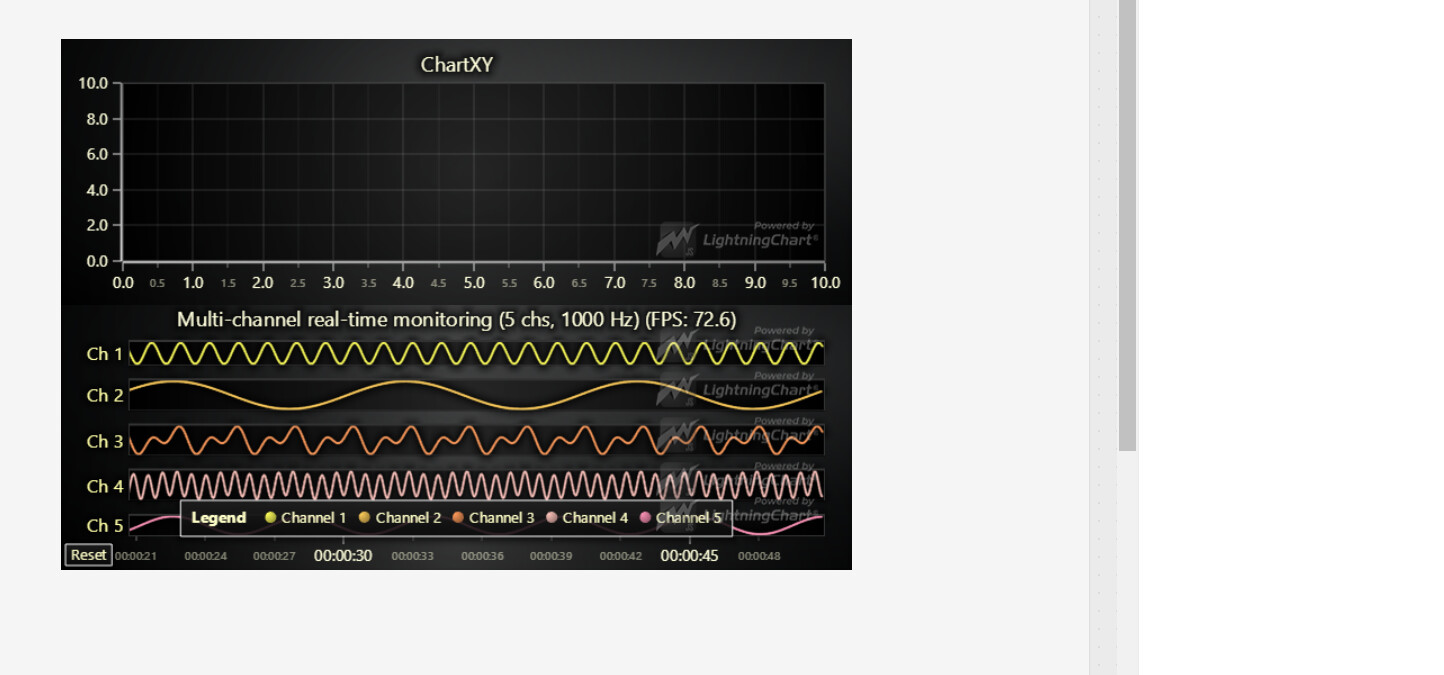
I am now trying to see if I can get this working with their other examples, such as this JavaScript Medical Dashboard
No luck thus far. I’ll post what I’ve done so far, maybe you can give me some pointers? ![]()
<html>
  <head>
  </head>
  <body>
    <div id="lightningChart"></div>

  </body>
  <script src="https://cdn.jsdelivr.net/npm/@arction/lcjs@4.0.2/dist/lcjs.iife.js"></script>

  <script>

const {
    lightningChart,
    AutoCursorModes,
    emptyLine,
    AxisTickStrategies,
    AxisScrollStrategies,
    synchronizeAxisIntervals,
    UIOrigins,
    UIDraggingModes,
    LegendBoxBuilders,
    Themes,
} = lcjs
  const chart = lightningChart().ChartXY(document.getElementById(“lightningChart"));

  const SIGNALS = new Array(5).fill(0).map((_, i) => ({
    title: `Ch ${i + 1}`,
}))
const DEFAULT_X_RANGE_MS = 30 * 1000
const PADDING_BOTTOM = 30
const PADDING_TOP = 40
const PADDING_LEFT = 100
const PADDING_AXIS_Y = 6

const exampleContainer = document.getElementById('chart') || document.body

const dashboard = lightningChart()
    .Dashboard({
        numberOfColumns: 1,
        numberOfRows: SIGNALS.length,
        theme: Themes.darkGold,
    })
    .setSplitterStyle(emptyLine)

/**
 * Function updates heights of charts in Dashboard. Should be called on resize/etc. for interactive applications.
 */
const layoutDashboard = () => {
    const totalHeight = exampleContainer.getBoundingClientRect().height
    const signalHeight = (totalHeight - PADDING_BOTTOM - PADDING_TOP) / SIGNALS.length

    SIGNALS.forEach((_, iSignal) => {
        const chHeight = signalHeight + (iSignal === 0 ? PADDING_TOP : 0) + (iSignal === SIGNALS.length - 1 ? PADDING_BOTTOM : 0)
        dashboard.setRowHeight(iSignal, chHeight)
    })
}
requestAnimationFrame(layoutDashboard)

const channels = SIGNALS.map((signal, iSignal) => {
    const chart = dashboard
        .createChartXY({
            columnIndex: 0,
            rowIndex: iSignal,
        })
        .setTitle('')
        .setPadding({
            top: iSignal > 0 ? PADDING_AXIS_Y : 0,
            bottom: iSignal < SIGNALS.length - 1 ? PADDING_AXIS_Y : 0,
            left: 0,
        })
        .setAutoCursorMode(AutoCursorModes.disabled)
        .setBackgroundStrokeStyle(emptyLine)
        .setMouseInteractions(false)

    const axisX = chart
        .getDefaultAxisX()
        .setTickStrategy(AxisTickStrategies.Empty)
        .setStrokeStyle(emptyLine)
        .setScrollStrategy(AxisScrollStrategies.progressive)
        .setInterval({ start: -DEFAULT_X_RANGE_MS, end: 0, stopAxisAfter: false })
    const axisY = chart
        .getDefaultAxisY()
        .setTickStrategy(AxisTickStrategies.Empty)
        .setStrokeStyle(emptyLine)
        .setTitle(signal.title)
        .setTitleRotation(0)
        .setThickness(60)

    const series = chart
        .addLineSeries({
            dataPattern: { pattern: 'ProgressiveX' },
            automaticColorIndex: iSignal,
        })
        .setName(`Channel ${iSignal + 1}`)
        .setDataCleaning({ minDataPointCount: 10000 })
        // Use 2 thickness for smooth anti-aliased thick lines with the best visual look, this is pretty GPU heavy.
        .setStrokeStyle((style) => style.setThickness(2))

    return { chart, series, axisX, axisY }
})
const channelTop = channels[0]
const channelBottom = channels[channels.length - 1]

channelTop.chart.setTitle(`Multi-channel real-time monitoring (${SIGNALS.length} chs, 1000 Hz)`)

const axisX = channelBottom.axisX
    .setThickness(PADDING_BOTTOM)
    .setTickStrategy(AxisTickStrategies.Time, (ticks) =>
        ticks
            .setMajorTickStyle((major) => major.setGridStrokeStyle(emptyLine))
            .setMinorTickStyle((minor) => minor.setGridStrokeStyle(emptyLine)),
    )
synchronizeAxisIntervals(...channels.map((ch) => ch.axisX))

// axisX.setInterval({ start: -DEFAULT_X_RANGE_MS, end: 0, stopAxisAfter: false })

// Add legend
const legend = dashboard
    .addLegendBox(LegendBoxBuilders.HorizontalLegendBox)
    .setPosition({ x: 50, y: 0 })
    .setOrigin(UIOrigins.CenterBottom)
    .setMargin({ bottom: PADDING_BOTTOM })
    .setDraggingMode(UIDraggingModes.notDraggable)
channels.forEach((channel) => legend.add(channel.series))

// Custom interactions for zooming in/out along Time axis while keeping data scrolling.
axisX.setNibInteractionScaleByDragging(false).setNibInteractionScaleByWheeling(false).setAxisInteractionZoomByWheeling(false)
const customZoomX = (_, event) => {
    const interval = axisX.getInterval()
    const range = interval.end - interval.start
    const newRange = range + Math.sign(event.deltaY) * 0.1 * Math.abs(range)
    axisX.setInterval({ start: interval.end - newRange, end: interval.end, stopAxisAfter: false })
    event.preventDefault()
    event.stopPropagation()
}
axisX.onAxisInteractionAreaMouseWheel(customZoomX)
channels.forEach((channel) => {
    channel.chart.onSeriesBackgroundMouseWheel(customZoomX)
    channel.series.onMouseWheel(customZoomX)
})

// Add LCJS user interface button for resetting view.
const buttonReset = dashboard
    .addUIElement()
    .setText('Reset')
    .setPosition({ x: 0, y: 0 })
    .setOrigin(UIOrigins.LeftBottom)
    .setMargin({ left: 4, bottom: 4 })
    .setDraggingMode(UIDraggingModes.notDraggable)
buttonReset.onMouseClick((_) => {
    const xMax = channels[0].series.getXMax()
    axisX.setInterval({ start: xMax - DEFAULT_X_RANGE_MS, end: xMax, stopAxisAfter: false })
    channels.forEach((channel) => channel.axisY.fit())
})

// Generate data sets that is repeated for each channel for demonstration purposes.
const dataSets = [
    { length: Math.ceil(400 * Math.PI), func: (x) => 8 * Math.sin(x / 200) },
    { length: Math.ceil(3200 * Math.PI), func: (x) => 7 * Math.sin(x / 1600) },
    { length: Math.ceil(800 * Math.PI), func: (x) => 4 * (Math.cos(x / 400) + Math.sin(x / 200)) },
    { length: Math.ceil(800 * Math.PI), func: (x) => 6 * Math.sin(x / 100) + Math.cos(x / 400) },
    { length: Math.ceil(1800 * Math.PI), func: (x) => 8 * Math.cos(x / 900) },
].map((config) => {
    const data = []
    data.length = config.length
    for (let i = 0; i < config.length; i += 1) {
        const y = config.func(i)
        data[i] = y
    }
    return data
})

// Stream data into series.
let tStart = window.performance.now()
let pushedDataCount = 0
const dataPointsPerSecond = 1000 // 1000 Hz
const xStep = 1000 / dataPointsPerSecond
const streamData = () => {
    const tNow = window.performance.now()
    // NOTE: This code is for example purposes (streaming stable data rate without destroying browser when switching tabs etc.)
    // In real use cases, data should be pushed in when it comes.
    const shouldBeDataPointsCount = Math.floor((dataPointsPerSecond * (tNow - tStart)) / 1000)
    const newDataPointsCount = Math.min(shouldBeDataPointsCount - pushedDataCount, 1000) // Add max 1000 data points per frame into a series. This prevents massive performance spikes when switching tabs for long times
    const seriesNewDataPoints = []
    for (let iChannel = 0; iChannel < channels.length; iChannel++) {
        const dataSet = dataSets[iChannel % dataSets.length]
        const newDataPoints = []
        for (let iDp = 0; iDp < newDataPointsCount; iDp++) {
            const x = (pushedDataCount + iDp) * xStep
            const iData = (pushedDataCount + iDp) % dataSet.length
            const y = dataSet[iData]
            const point = { x, y }
            newDataPoints.push(point)
        }
        seriesNewDataPoints[iChannel] = newDataPoints
    }
    channels.forEach((channel, iChannel) => channel.series.add(seriesNewDataPoints[iChannel]))
    pushedDataCount += newDataPointsCount
    requestAnimationFrame(streamData)
}
streamData()

// Measure FPS.
let tFpsStart = window.performance.now()
let frames = 0
let fps = 0
const title = channelTop.chart.getTitle()
const recordFrame = () => {
    frames++
    const tNow = window.performance.now()
    fps = 1000 / ((tNow - tFpsStart) / frames)
    requestAnimationFrame(recordFrame)

    channelTop.chart.setTitle(`${title} (FPS: ${fps.toFixed(1)})`)
}
requestAnimationFrame(recordFrame)
setInterval(() => {
    tFpsStart = window.performance.now()
    frames = 0
}, 5000)

  </script>
</html>Preformatted text