My goal: I believe I'm reaching the limits of configurability of chart components
(Example - I would like to convert the data labels in my bar chart to percentages of total, but there are a few other items as well)
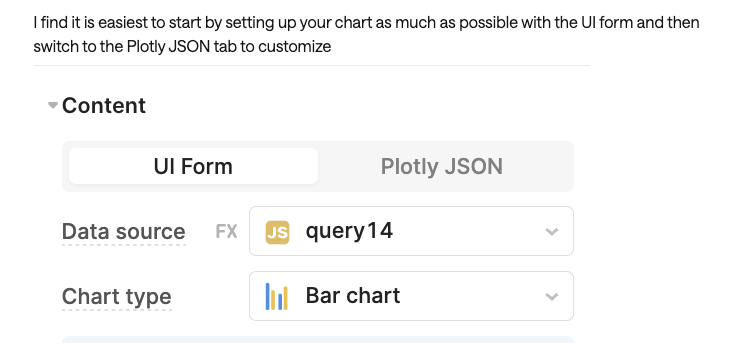
When looking for this particular issue I came across this page where the solution was to convert to plotly for additional functionality
Unfortunately the out of the box charts are quite limited with regards to editing the chart layouts. I was excited when they were initially rolled out, but it didn't last much.. so far i prefer using the json chart where i can customise all sorts of things for the layout.
If you're not familiar with how this works, my recommendation is to ask chat gpt to generate a js query in retool (or better yet a transformer, but remember to explain that curly brackets are needed to refer to data and components) where it returns an array with 2 objects for a plotly chart, one for the data, and one for the layout. Provide it with a json sample of your source data you want to use and specifics about how your x and y axises labels should show. Then you simply reference each object respectively in the json chart
I find this exercise very gratifying every time I do it, and it makes working with charts less of a headache