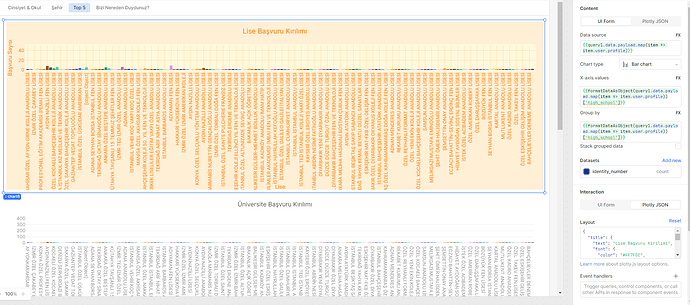
Hello, I have connected my data to a table with an api and I am trying to create a chart over the table data. But since there are many options with low values, I guess they are not very readable.
My priority is to show the 5 options with the most values, but I couldn't do it with js code.
