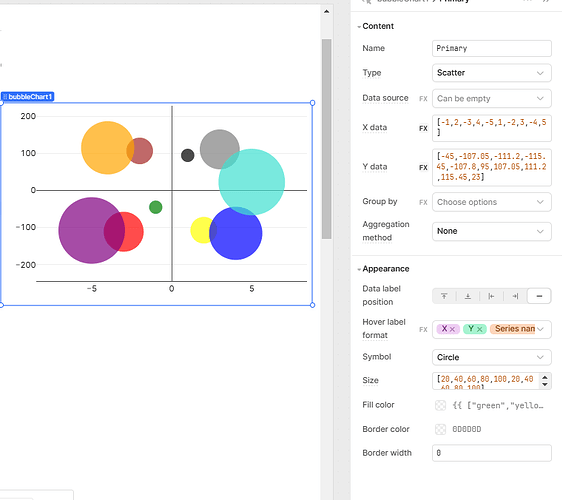
i'm a football analyst and I'm trying to develop a bubble chart with 20 markers to represent each team that I would like to animate across game weeks to demonstrate changes in each teams performance. I'm struggling to get this to work using retool's chart component through plotly data and layout. I've tried develop some mock data and layout json for me to isolate how I need to structure my SQL query output but still can't get it it to work. is it even possible? I've researched and found that retool is capable of interesting animations on bubble charts but no more information... Chart animation
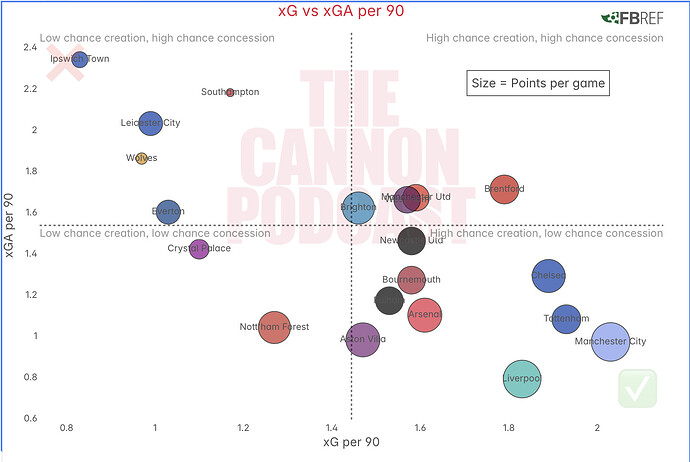
here is the existing static bubble chart that is powered by a SQL query but only shows season-to-date data. I understand that the data and layout will need to be restructured to manage animation across multiple frames of data and will have implications on how I structure the data in my SQL query.
here is the code I've used for DATA
[
{
"name": "xG per 90",
"x": {{ bubble_chancecreation.data.xgper90 }},
"y": {{ bubble_chancecreation.data.xgaper90 }},
"type": "scatter",
"mode": "markers+text",
"marker": {
"size": {{ bubble_chancecreation.data.ptspergamescaled }},
"sizemode": "area",
"line": {
"color": "black",
"width": 1
}
},
"text": {{ bubble_chancecreation.data.squad }},
"textposition": "middle center",
"customdata": {{ bubble_chancecreation.data.ptspergame }},
"hovertemplate": "%{text}
Points per game: %{customdata}",
"transforms": [
{
"type": "groupby",
"groups": {{ bubble_chancecreation.data.squad }},
"styles": {{ _.map(bubble_chancecreation.data.squad, (squad, index) => ({
"target": squad,
"value": {
"marker": {
"color": bubble_chancecreation.data.hex[index],
"line": {
"color": "black", // Ensures each bubble has an outline
"width": 1 // Consistent outline width
}
}
}
})) }}
},
{
"type": "sort",
"target": {{ bubble_chancecreation.data.xgper90 }},
"order": "ascending"
},
{
"type": "aggregate",
"groups": {{ bubble_chancecreation.data.squad }},
"aggregations": [
{
"target": "y",
"func": "sum",
"enabled": true
}
]
}
],
"showlegend": false
}
]
and LAYOUT
{
"title": {
"text": "xG vs xGA per 90",
"font": {
"color": "#DF1B39",
"size": 20
}
},
"font": {
"family": "Inter",
"color": "#555"
},
"showlegend": false,
"legend": {
"xanchor": "center",
"x": 0.45,
"y": -0.2,
"orientation": "h"
},
"margin": {
"l": 16,
"r": 24,
"t": 40,
"b": 32,
"pad": 2
},
"hovermode": "closest",
"hoverlabel": {
"bgcolor": "#000",
"bordercolor": "#000",
"font": {
"color": "#fff",
"family": "var(--default-font, var(--sans-serif))",
"size": 12
}
},
"xaxis": {
"title": {
"text": "xG per 90",
"standoff": 6,
"font": {
"size": 16
}
},
"type": "-",
"tickformat": "",
"automargin": true,
"fixedrange": true,
"gridcolor": "#fff",
"zerolinecolor": "#fff",
"gridcolor": "rgba(0, 0, 0, 0)" // No horizontal gridlines
},
"yaxis": {
"title": {
"text": "xGA per 90",
"standoff": 6,
"font": {
"size": 16
}
},
"type": "linear",
"tickformat": "",
"automargin": true,
"fixedrange": true,
"zerolinecolor": "#DEDEDE",
"gridcolor": "rgba(0, 0, 0, 0)" // No horizontal gridlines
},
"images": [
{
"source": "https://i.ibb.co/JRFD0N5/The-Cannon-Text-06.png",
"xref": "paper",
"yref": "paper",
"x": 0.5,
"y": 0.9,
"sizex": 0.45,
"sizey": 0.45,
"xanchor": "center",
"yanchor": "center",
"opacity": 0.1,
"layer": "below"
},
{
"source": "https://cdn.ssref.net/nocdn/logos/fb-logo.svg",
"xref": "paper",
"yref": "paper",
"x": 1,
"y": 1.05,
"sizex": 0.1,
"sizey": 0.05,
"xanchor": "right",
"yanchor": "top",
"opacity": 1,
"layer": "above"
},
{
"source": "https://emojicdn.elk.sh/❌",
"xref": "paper",
"yref": "paper",
"x": 0.01,
"y": 0.97,
"sizex": 0.1,
"sizey": 0.1,
"xanchor": "left",
"yanchor": "top",
"opacity": 0.15,
"layer": "above"
},
{
"source": "https://emojicdn.elk.sh/✅",
"xref": "paper",
"yref": "paper",
"x": 0.99,
"y": 0.03,
"sizex": 0.1,
"sizey": 0.1,
"xanchor": "right",
"yanchor": "bottom",
"opacity": 0.15,
"layer": "above"
}
],
"annotations": [
{
"text": "Size = Points per game",
"xref": "paper",
"yref": "paper",
"x": 0.8,
"y": 0.9,
"showarrow": false,
"font": {
"size": 16,
"color": "#000"
},
"align": "center",
"xanchor": "center",
"yanchor": "top",
"bgcolor": "rgba(255, 255, 255, 1)",
"bordercolor": "#000",
"borderwidth": 1,
"borderpad": 6,
"opacity": 0.7
},
{
"text": "Low chance creation, high chance concession",
"xref": "paper",
"yref": "paper",
"x": 0.0,
"y": 1,
"showarrow": false,
"font": {
"size": 14,
"color": "#000"
},
"align": "left",
"xanchor": "left",
"yanchor": "left",
"bgcolor": "rgba(255, 255, 255, 1)",
"bordercolor": "#000",
"borderwidth": 0,
"borderpad": 0,
"opacity": 0.4
},
{
"text": "High chance creation, high chance concession",
"xref": "paper",
"yref": "paper",
"x": 1,
"y": 1,
"showarrow": false,
"font": {
"size": 14,
"color": "#000"
},
"align": "right",
"xanchor": "right",
"yanchor": "right",
"bgcolor": "rgba(255, 255, 255, 1)",
"bordercolor": "#000",
"borderwidth": 0,
"borderpad": 0,
"opacity": 0.4
},
{
"text": "Low chance creation, low chance concession",
"xref": "paper",
"yref": "paper",
"x": 0.0,
"y": 0.48,
"showarrow": false,
"font": {
"size": 14,
"color": "#000"
},
"align": "left",
"xanchor": "left",
"yanchor": "left",
"bgcolor": "rgba(255, 255, 255, 1)",
"bordercolor": "#000",
"borderwidth": 0,
"borderpad": 0,
"opacity": 0.4
},
{
"text": "High chance creation, low chance concession",
"xref": "paper",
"yref": "paper",
"x": 1,
"y": 0.48,
"showarrow": false,
"font": {
"size": 14,
"color": "#000"
},
"align": "right",
"xanchor": "right",
"yanchor": "center",
"bgcolor": "rgba(255, 255, 255, 1)",
"bordercolor": "#000",
"borderwidth": 0,
"borderpad": 0,
"opacity": 0.4
}
],
"data": [
{
"type": "scatter",
"mode": "markers",
"x": [/* x values /],
"y": [/ y values /],
"marker": {
"color": [/ color values /],
"opacity": 0.7,
"size": [/ size values */],
"colorscale": "Blues",
"line": {
"color": "black",
"width": 1
},
"gradient": {
"type": "radial",
"color": "#000",
"radius": 0.85
}
}
}
],
"shapes": [
{
"type": "line",
"x0": "0",
"y0": "0.5",
"x1": "1",
"y1": "0.5",
"xref": "paper",
"yref": "paper",
"line": {
"color": "rgba(0, 0, 0, 0.5)",
"width": 2,
"dash": "dot"
}
},
{
"type": "line",
"x0": "0.5",
"y0": "0",
"x1": "0.5",
"y1": "1",
"xref": "paper",
"yref": "paper",
"line": {
"color": "rgba(0, 0, 0, 0.5)",
"width": 2,
"dash": "dot"
}
}
]
}


