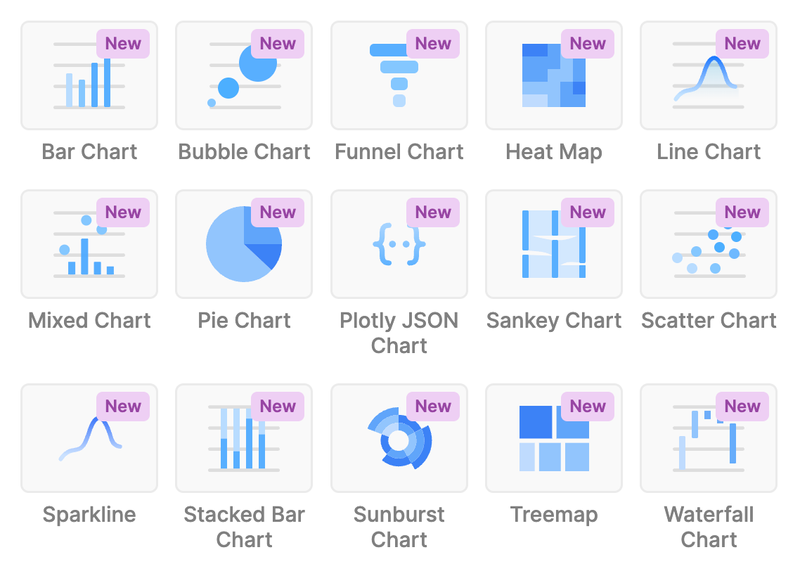
Hey folks! Great news. Retool now supports 15 preset chart components, eliminating the need to manually write Plotly JSON for basic chart types. This change enables users to more easily create and customize chart and graphs in their apps.
Features of the new chart components include:
Support for multiple data sources in series-based charts.
Data grouping and aggregation.
Customizeable titles, legends, labels, and toolbars.
Configurable user interactivity.
Advanced use cases using the Plotly JSON Chart.
Retool now provides the following chart components:
The new chart components are generally available on Retool Cloud. They will be generally available in a subsequent edge release of Self-hosted Retool and the upcoming stable release.
Already had the chance to explore this in beta, and it's fantastic! The 15 preset chart components are a huge leap forward—especially the ability to handle multiple data sources, aggregate data, and tweak interactivity so seamlessly. Not having to manually code the Plotly JSON for basic charts really saves time. Excited to see this rolling out widely!
Is it possible to disable a series? For example, we allow users the option to break down data by certain dimensions (e.g., device) and would like to plot that breakdown in a series alongside a total. They don't have to select a breakdown, though, and we would like to disable the series in that case and just show the total. I can't seem to figure out a way to do that currently.
Hi @drewski, thank you for this suggestion. While it's not possible to disable a series at this time, I created a feature request for this. I'll comment here with any updates .
Awesome!
Any Retool team member have an idea around how hover-tooltips are handled and how to eventually combine series?
Those 2 topics cover the same question: