My goal: Turn line chart data labels on and off with a button, or allow the user to specify which lables are on for certain data points.
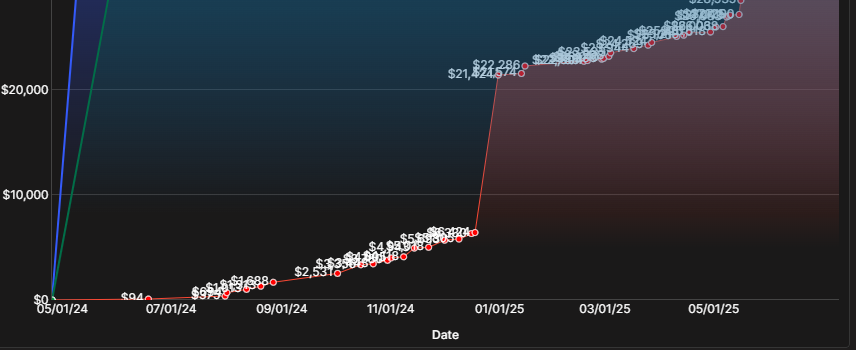
Issue: Label Congestion on Chart
Steps I've taken to troubleshoot: multiple lines each only one point
Additional info: (Cloud or Self-hosted, Screenshots): Cloud
Basically if there are a lot of points on a line chart in a small area, it becomes congested, I just need a way of specifying which labels are on, or at least let me turn labels on and off for a line with a var. Here's an example of what I mean. I mean it would be really nice if the retool component auto handeled this but I understand that w/ such a complex component not everything can be supported. I would just like the option of doing it myself w/ js
Apologies for the issue with the clutter. I agree, I wish there was an easier way to dynamically control how these are displayed.
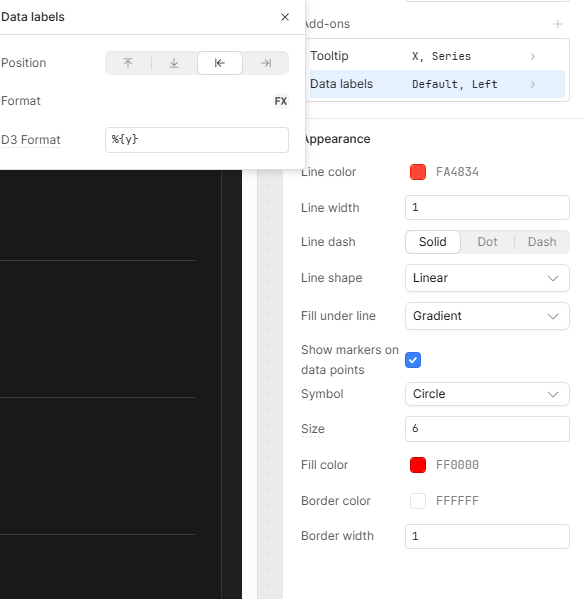
The Line Chart component uses the D3.js library under the hood, so any granular control would involve using controls from that library in the component's input fields.
I just tried setting the 'Data Labels' D3 Format to a variable who's value I switched between %{y} and an empty string to see if I could have a button control turning all of one line's labels on and off, but found that the chart isn't dynamically refreshing on variable change as I had expected.
So I am going to make a bug report for this. As it seems reasonable to be able to turn a specific lines labels on and off. For more granular control I would have to defer to much more complex D3 logic to specify when points along a line are labeled or not.