-
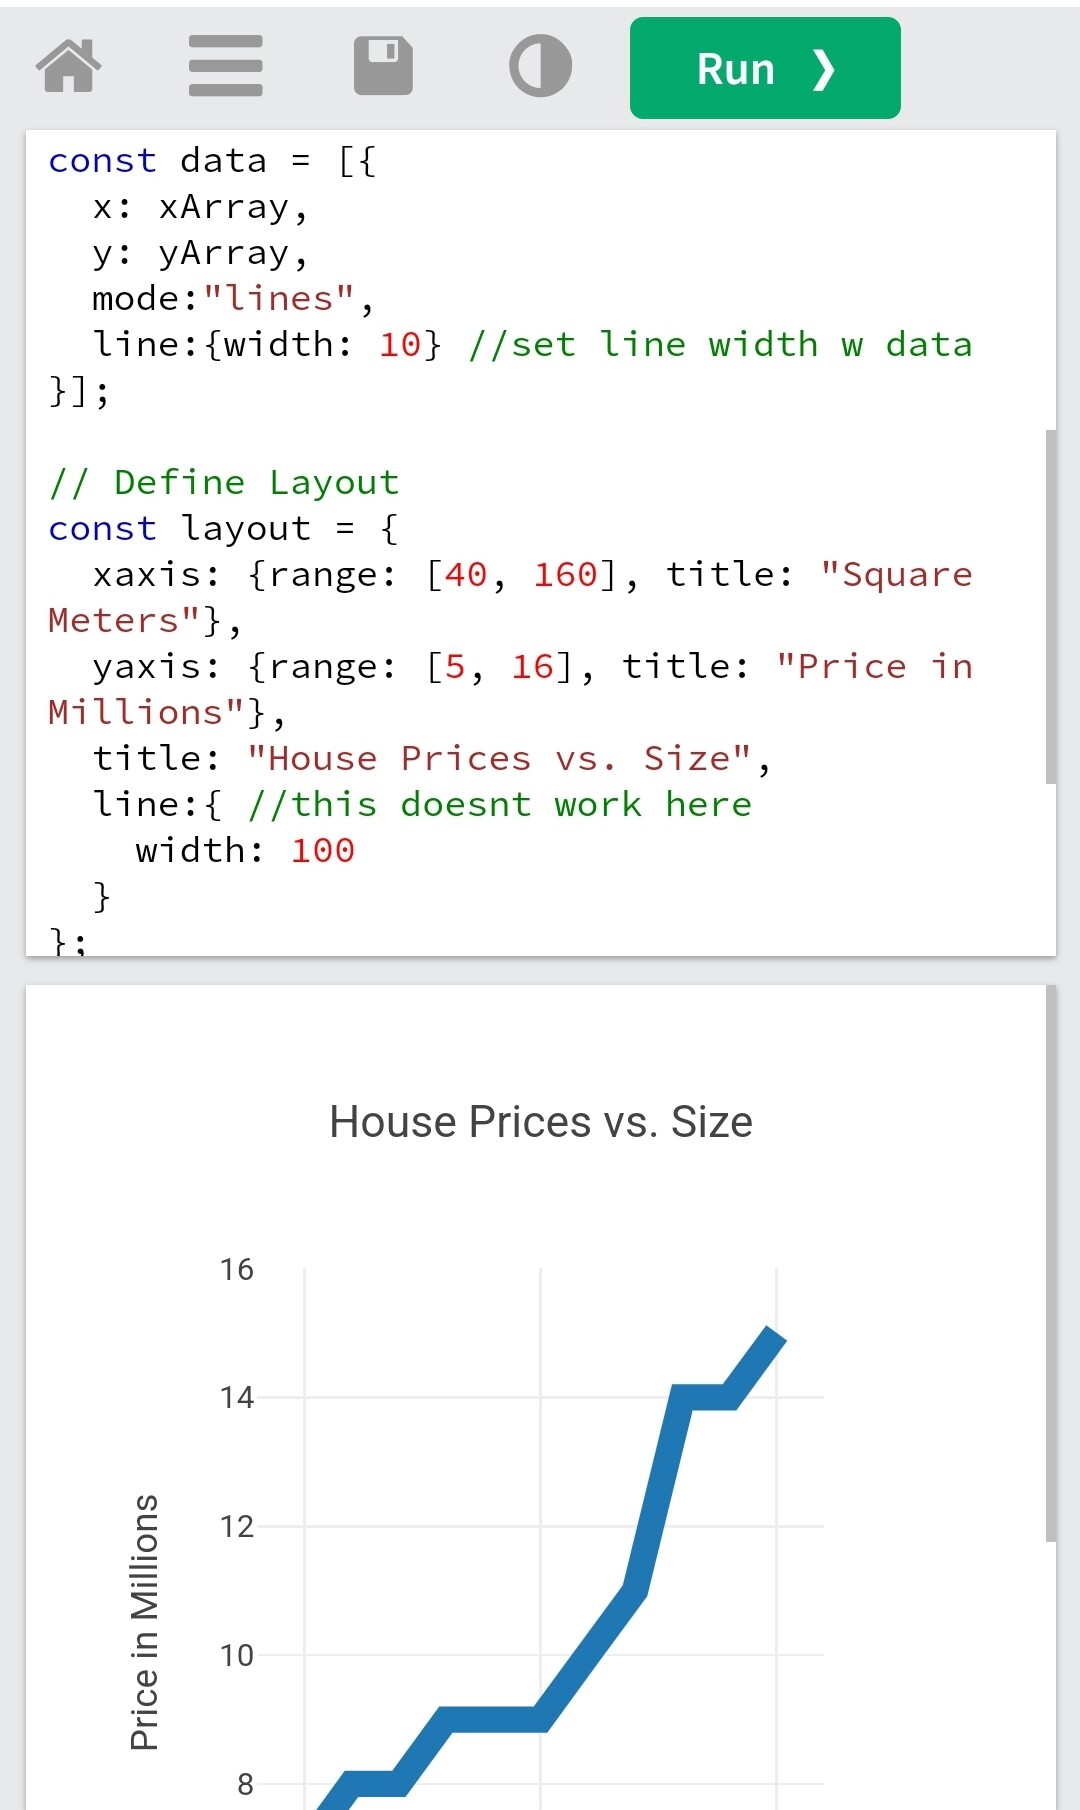
Goal: change the plot line width on my line chart
-
Steps: current config:
{
  "title": {
    "text": "Order Conversation Length",
    "font": {
      "color": "#3D3D3D",
      "size": 16
    }
  },
  "font": {
    "family": "var(--default-font, var(--sans-serif))",
    "color": "#979797"
  },
  "showlegend": true,
  "legend": {
    "xanchor": "center",
    "x": 0.5,
    "y": 1.1,
    "orientation": "h"
  },
  "margin": {
    "l": 72,
    "r": 24,
    "t": 80,
    "b": 72,
    "pad": 2
  },
  "hovermode": "closest",
  "hoverlabel": {
    "bgcolor": "#000",
    "bordercolor": "#000",
    "font": {
      "color": "#fff",
      "family": "var(--default-font, var(--sans-serif))",
      "size": 12
    }
  },
  "clickmode": "select+event",
  "dragmode": "select",
  "xaxis": {
    "title": {
      "text": "time",
      "standoff": 6,
      "font": {
        "size": 12
      }
    },
    "type": "-",
    "tickformat": "",
    "automargin": true,
    "fixedrange": true,
    "gridcolor": "#fff",
    "zerolinecolor": "#fff"
  },
  "yaxis": {
    "title": {
      "text": "recording time in seconds",
      "standoff": 6,
      "font": {
        "size": 12
      }
    },
    "type": "linear",
    "tickformat": "",
    "automargin": true,
    "fixedrange": true,
    "zerolinecolor": "#DEDEDE"
  },
  "line": {
    "width": 1
  }
}
-
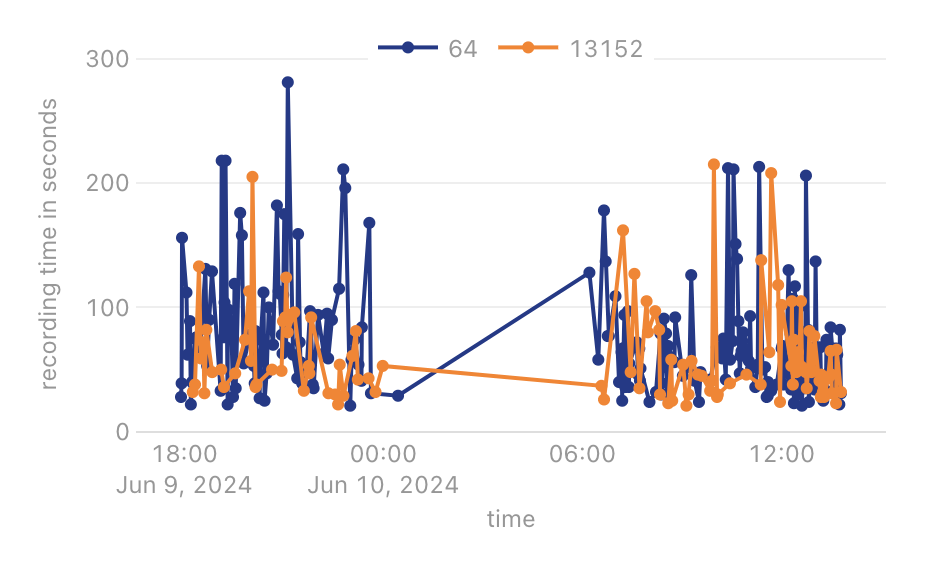
Details: I'm plotting multiple lines and plotly is doing pretty well at automating a lot of what I need. The problem is that when I go to plot more than 1 line the lines start to obfuscate one another because the default line width is too thick. How can I change the line thickness? I've tried the config above, reviewing the docs, reviewing the plotly docs, as well as looking for retool examples, but haven't been able to make any progress.
-
Screenshots: