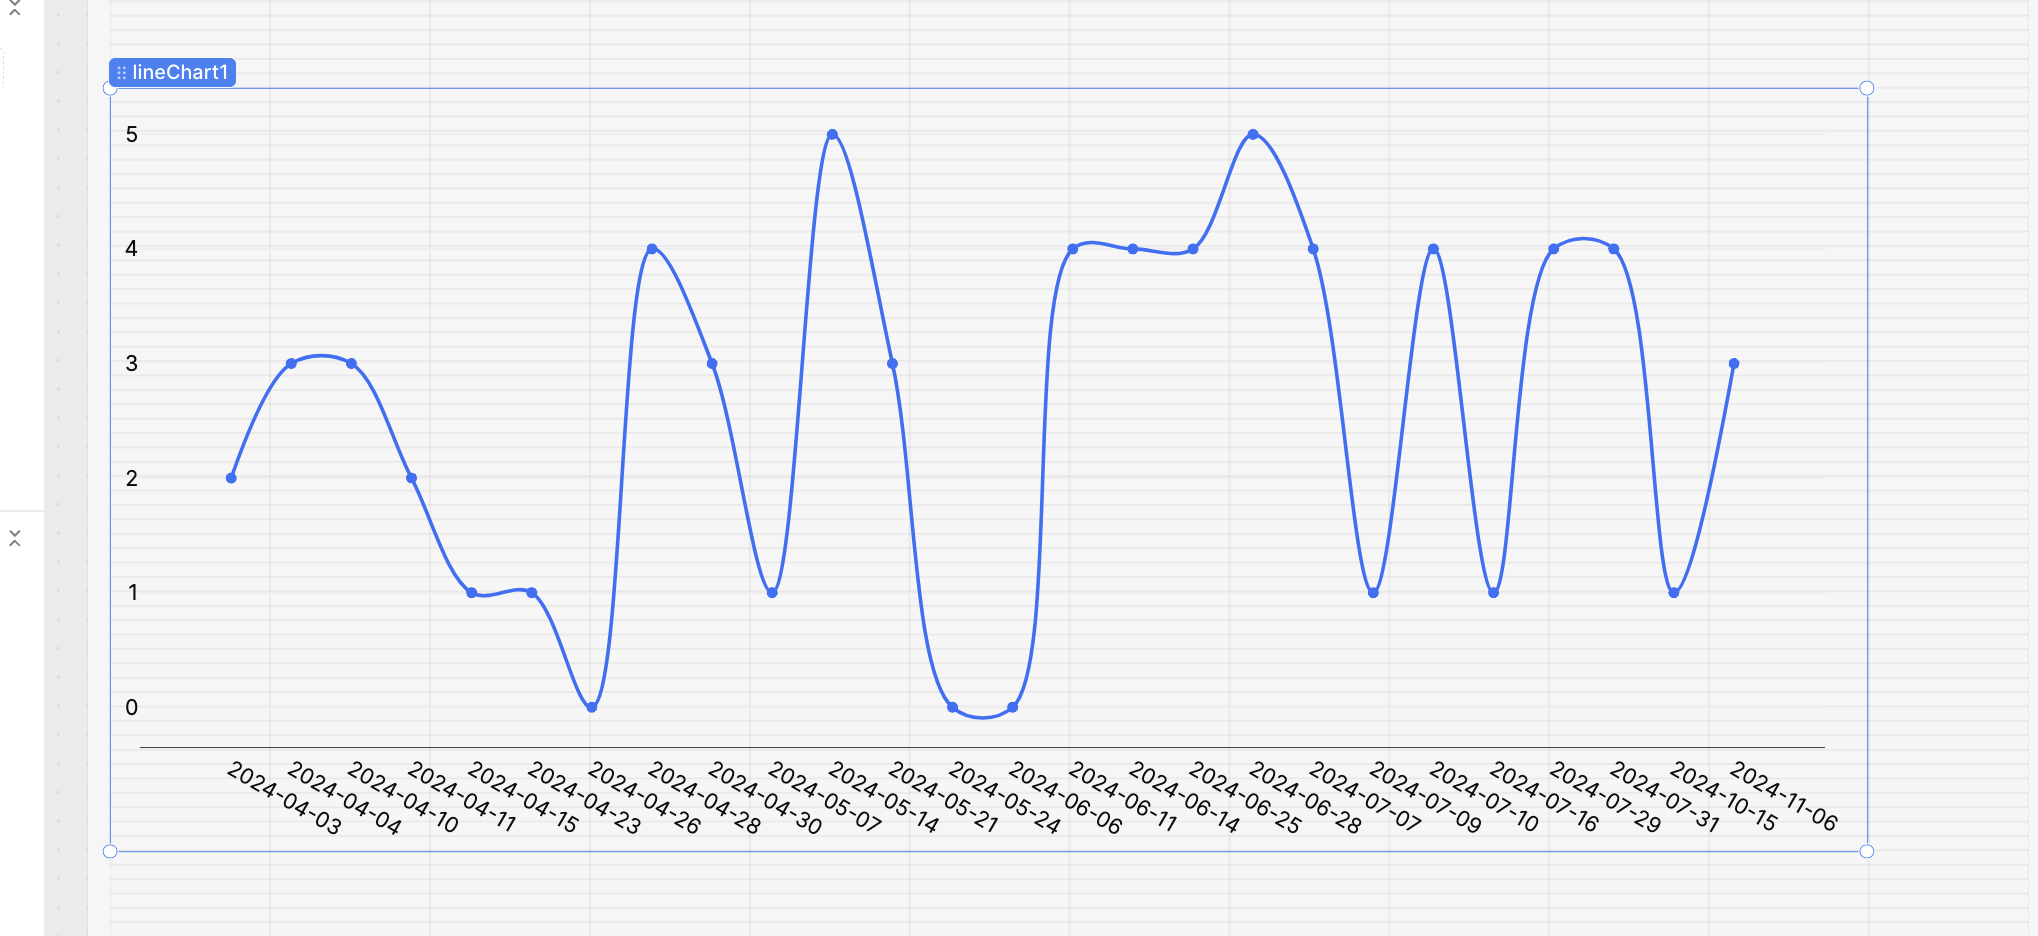
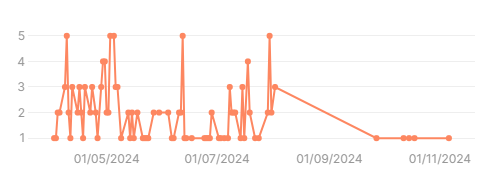
I'm trying to migrate a chart from the legacy component to new one. My chart is a line chart with nbUsers as the y-axis and date as the x-axis. It looks like this with the legacy component:
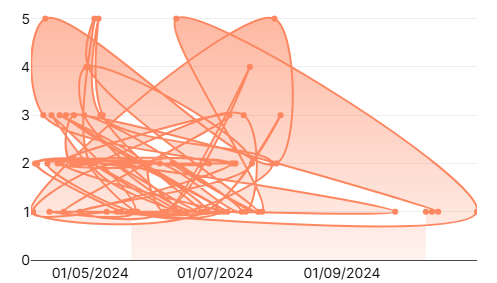
With the new component, when I select Date for the scale of the x-axis, the scale is appropriate but the data points are not linked in the right order:
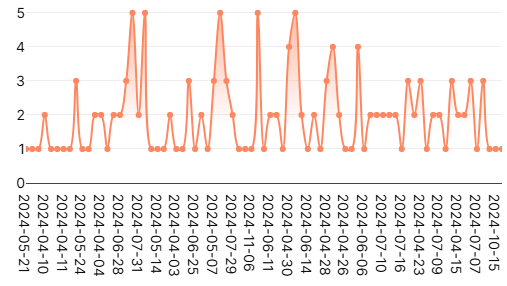
I've tried using Category as the scale, the line is correct but every single date is displayed on the axis and they are not grouped by appropriate time frame:
Is there a way to get the intended behavior with the new component?