Group by affects sorting in chart

Hi,

I construct my data like this:

const data = query1.data.map((obj) => {
  const date = new Date(obj.PaymentDate);
  const month = date.toLocaleString('en-US', { month: 'short' });
  return {
    AmountGBP: obj.AmountGBP * 0.01,
    AccountType: obj.AccountType,
    CustomerName: obj.CustomerName,
    Month:month
  };
});

return data

My plotly JSON looks like this:

[
  {
    "name": "AmountGBP",
    "x": {{formatDataAsObject(allPaymentsPerMonth.data).Month}},
    "y": {{formatDataAsObject(allPaymentsPerMonth.data).AmountGBP}},        
    "type": "bar",
    "hovertemplate": "<b>%{x}</b><br>%{text}: %{y} <extra></extra>",
    "text": {{formatDataAsObject(allPaymentsPerMonth.data).CustomerName}},
    "transforms": [
       {
        "type": "sort",
        "target": {{ formatDataAsObject(allPaymentsPerMonth.data).Month.map(month => {
          return new Date(`01 ${month} 2023`);
        }) }},
        "order": "ascending"
      },
      {
        "type": "groupby",
        "groups": {{formatDataAsObject(allPaymentsPerMonthFiltered.data)['AccountType']}},
      },
      {
        "type": "aggregate",
        "groups": {{formatDataAsObject(allPaymentsPerMonth.data).Month}},
        "aggregations": [
          {
            "target": "y",
            "func": "count",
            "enabled": true
          },
        ]
      }
    ]
  }
]

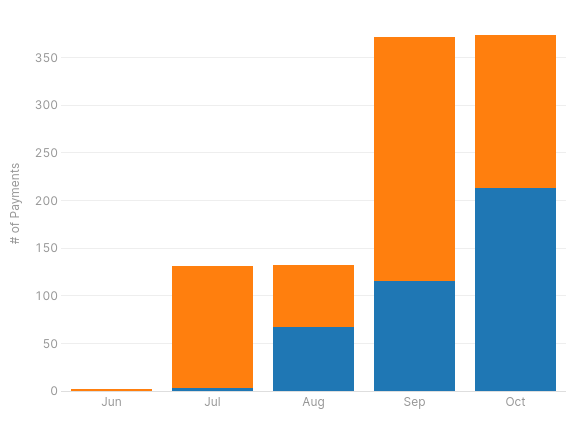
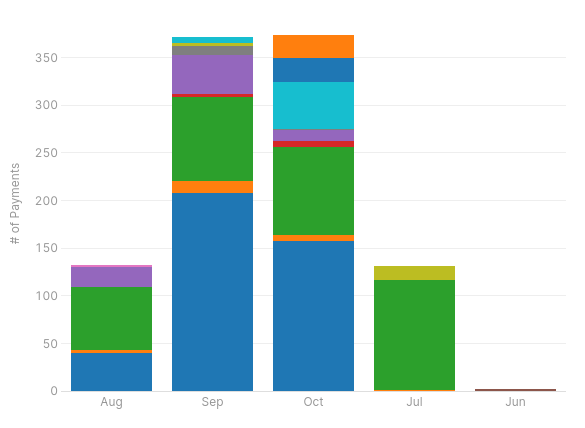
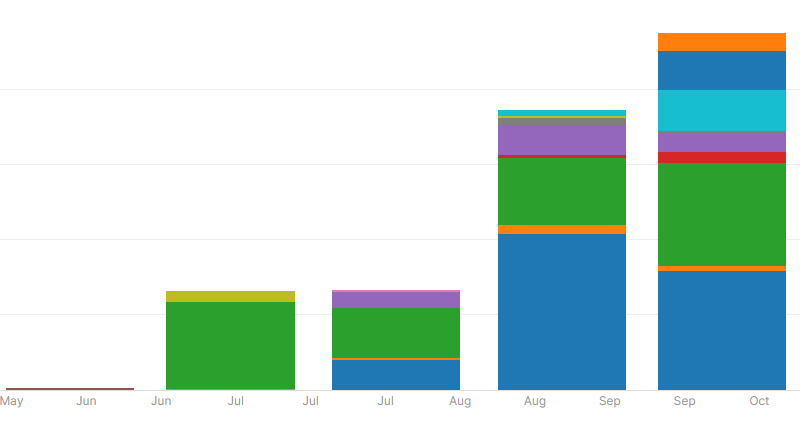
For some reason the order of the months change when I change "groups": {{formatDataAsObject(allPaymentsPerMonthFiltered.data)['AccountType']}} to "groups": {{formatDataAsObject(allPaymentsPerMonthFiltered.data)['CustomerName']}},. It is in correct order for AccountType but not for CustomerName. Is this a bug or am I doing something wrong?

Alphabetical by default?

But how does the change go from this:
image

To this:
image

The months Jul and Jun appears at the end but not when using AccountType

Maybe customer name contains duplicate data or account type is sorted easier because it may contain numbers?
Hard to know as I don't see the data and can't replicate it

But AccountType and CustomerName can be duplicate, that's why I group by AccountType/CustomerName. Here is some sample data:

[
  {
    "AmountGBP": 720,
    "AccountType": "balance",
    "CustomerName": "Company 1",
    "Month": "Sep"
  },
  {
    "AmountGBP": 17771.93,
    "AccountType": "credit",
    "CustomerName": "Company 2",
    "Month": "Aug"
  },
  {
    "AmountGBP": 11308.14,
    "AccountType": "credit",
    "CustomerName": "Company 2",
    "Month": "Jun"
  },
  {
    "AmountGBP": 21063,
    "AccountType": "balance",
    "CustomerName": "Company 3",
    "Month": "Jul"
  }
]

OK I will test - can you add "order": "ascending" to that section where the issue exists?

Thank you. I am not sure what you mean. I already have "order": "ascending" in my plotly JSON as listed in the beginning

OK so I removed the sort and I moved the map but nothing seems to make it correct....this seems odd....

[
  {
    "name": "AmountGBP",
    "x": {{formatDataAsObject([  {    "AmountGBP": 720,    "AccountType": "balance",    "CustomerName": "Company 1",    "Month": "Sep"  },  {    "AmountGBP": 17771.93,    "AccountType": "credit",    "CustomerName": "Company 2",    "Month": "Aug"  },  {    "AmountGBP": 11308.14,    "AccountType": "credit",    "CustomerName": "Company 2",    "Month": "Jun"  },  {    "AmountGBP": 21063,    "AccountType": "balance",    "CustomerName": "Company 3",    "Month": "July"  }]).Month}},
    "y": {{formatDataAsObject([  {    "AmountGBP": 720,    "AccountType": "balance",    "CustomerName": "Company 1",    "Month": "Sep"  },  {    "AmountGBP": 17771.93,    "AccountType": "credit",    "CustomerName": "Company 2",    "Month": "Aug"  },  {    "AmountGBP": 11308.14,    "AccountType": "credit",    "CustomerName": "Company 2",    "Month": "Jun"  },  {    "AmountGBP": 21063,    "AccountType": "balance",    "CustomerName": "Company 3",    "Month": "July"  }]).AmountGBP}},        
    "type": "bar",
    "hovertemplate": "<b>%{x}</b><br>%{text}: %{y} <extra></extra>",
    "text": {{formatDataAsObject([  {    "AmountGBP": 720,    "AccountType": "balance",    "CustomerName": "Company 1",    "Month": "Sep"  },  {    "AmountGBP": 17771.93,    "AccountType": "credit",    "CustomerName": "Company 2",    "Month": "Aug"  },  {    "AmountGBP": 11308.14,    "AccountType": "credit",    "CustomerName": "Company 2",    "Month": "Jun"  },  {    "AmountGBP": 21063,    "AccountType": "balance",    "CustomerName": "Company 3",    "Month": "July"  }]).AccountType}},
    "transforms": [
{
        "type": "sort",
        "target": {{formatDataAsObject([  {    "AmountGBP": 720,    "AccountType": "balance",    "CustomerName": "Company 1",    "Month": "Sep"  },  {    "AmountGBP": 17771.93,    "AccountType": "credit",    "CustomerName": "Company 2",    "Month": "Aug"  },  {    "AmountGBP": 11308.14,    "AccountType": "credit",    "CustomerName": "Company 2",    "Month": "Jun"  },  {    "AmountGBP": 21063,    "AccountType": "balance",    "CustomerName": "Company 3",    "Month": "July"  }]).AccountType }},
        "order": "descending"
      },
       
      {
        "type": "groupby",
        "groups": {{formatDataAsObject([  {    "AmountGBP": 720,    "AccountType": "balance",    "CustomerName": "Company 1",    "Month": "Sep"  },  {    "AmountGBP": 17771.93,    "AccountType": "credit",    "CustomerName": "Company 2",    "Month": "Aug"  },  {    "AmountGBP": 11308.14,    "AccountType": "credit",    "CustomerName": "Company 2",    "Month": "Jun"  },  {    "AmountGBP": 21063,    "AccountType": "balance",    "CustomerName": "Company 3",    "Month": "July"  }]).CustomerName}},
      },
      {
        "type": "aggregate",
        "groups": {{formatDataAsObject([  {    "AmountGBP": 720,    "AccountType": "balance",    "CustomerName": "Company 1",    "Month": "Sep"  },  {    "AmountGBP": 17771.93,    "AccountType": "credit",    "CustomerName": "Company 2",    "Month": "Aug"  },  {    "AmountGBP": 11308.14,    "AccountType": "credit",    "CustomerName": "Company 2",    "Month": "Jun"  },  {    "AmountGBP": 21063,    "AccountType": "balance",    "CustomerName": "Company 3",    "Month": "July"  }]).Month.map(month => {
          return new Date(`01 ${month} 2023`);
        })}},
        "aggregations": [
          {
            "target": "y",
            "func": "count",
            "enabled": true
          },
        ]
      }
    ]
  }
]

Hi @Johan_Ekberg

I'm wondering if the following idea might work:

  1. Formatting the dates going in to the chart (Data source) using this JS:
.map(x=>{x.Month= moment(x.Month,'MMM').format('2023-MM-01'); return x})

2. Set the x-axis to type "Date" with %b formatting:

:crossed_fingers: hope it helps! I try to use the Date category if possible so that the chart can handle the sorting automatically

Thank you! This was exactly what I was looking for

Wonderful to hear!

I found a weird bug though. When in preview or the actual app the months of the x-axis are appearing a lot of times. This doesn't happen in dev-mode however. Do you know what is causing this?

Hmm I'm seeing the same issue :thinking:

It must be some default config for Dates. It looks like you can override this issue by switching to PlotlyJSON for the Interaction section and adding "dtick":"M1",under the xaxis (per the Plotly docs):