-
Goal: I would like to add vertical annotations on charts in Retool on specific dates (using Retool's chart component). Is there a way to do this?
-
Steps: I didn't see this in the docs, so wanted to check here to see if I'm missing something and if this is possible.
-
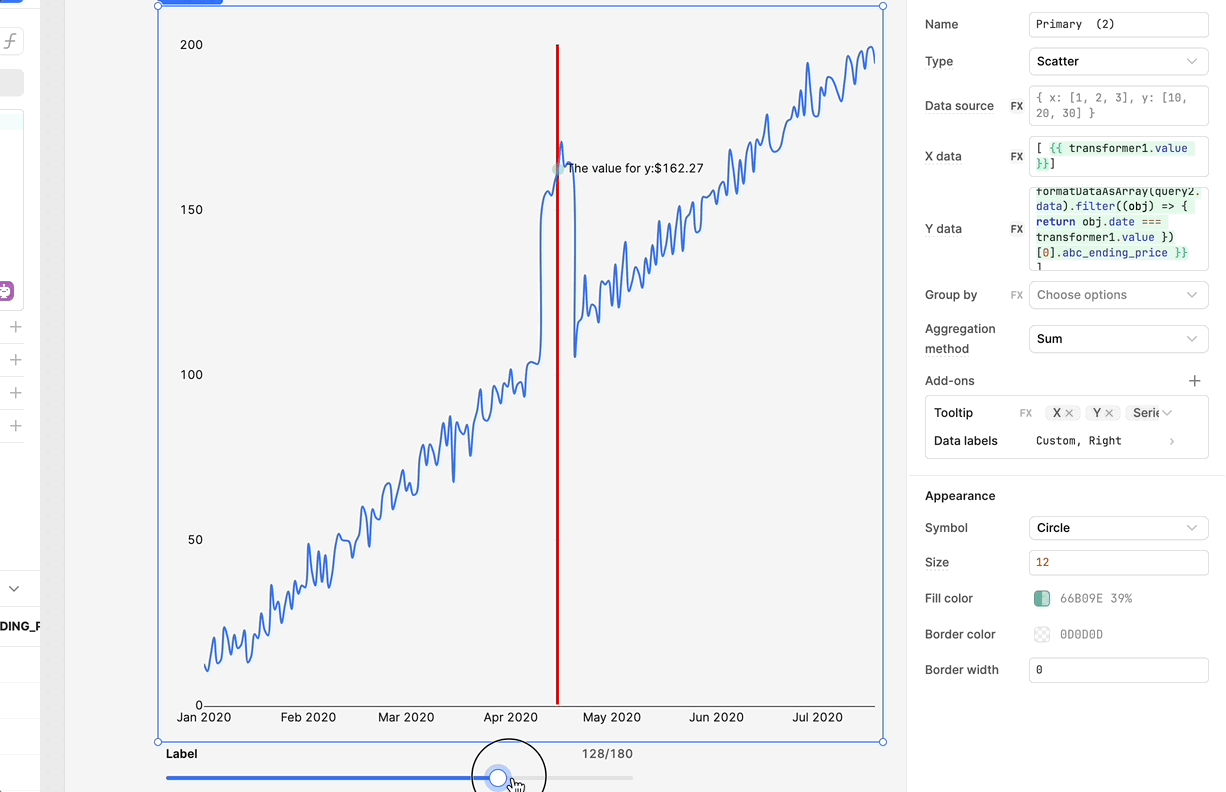
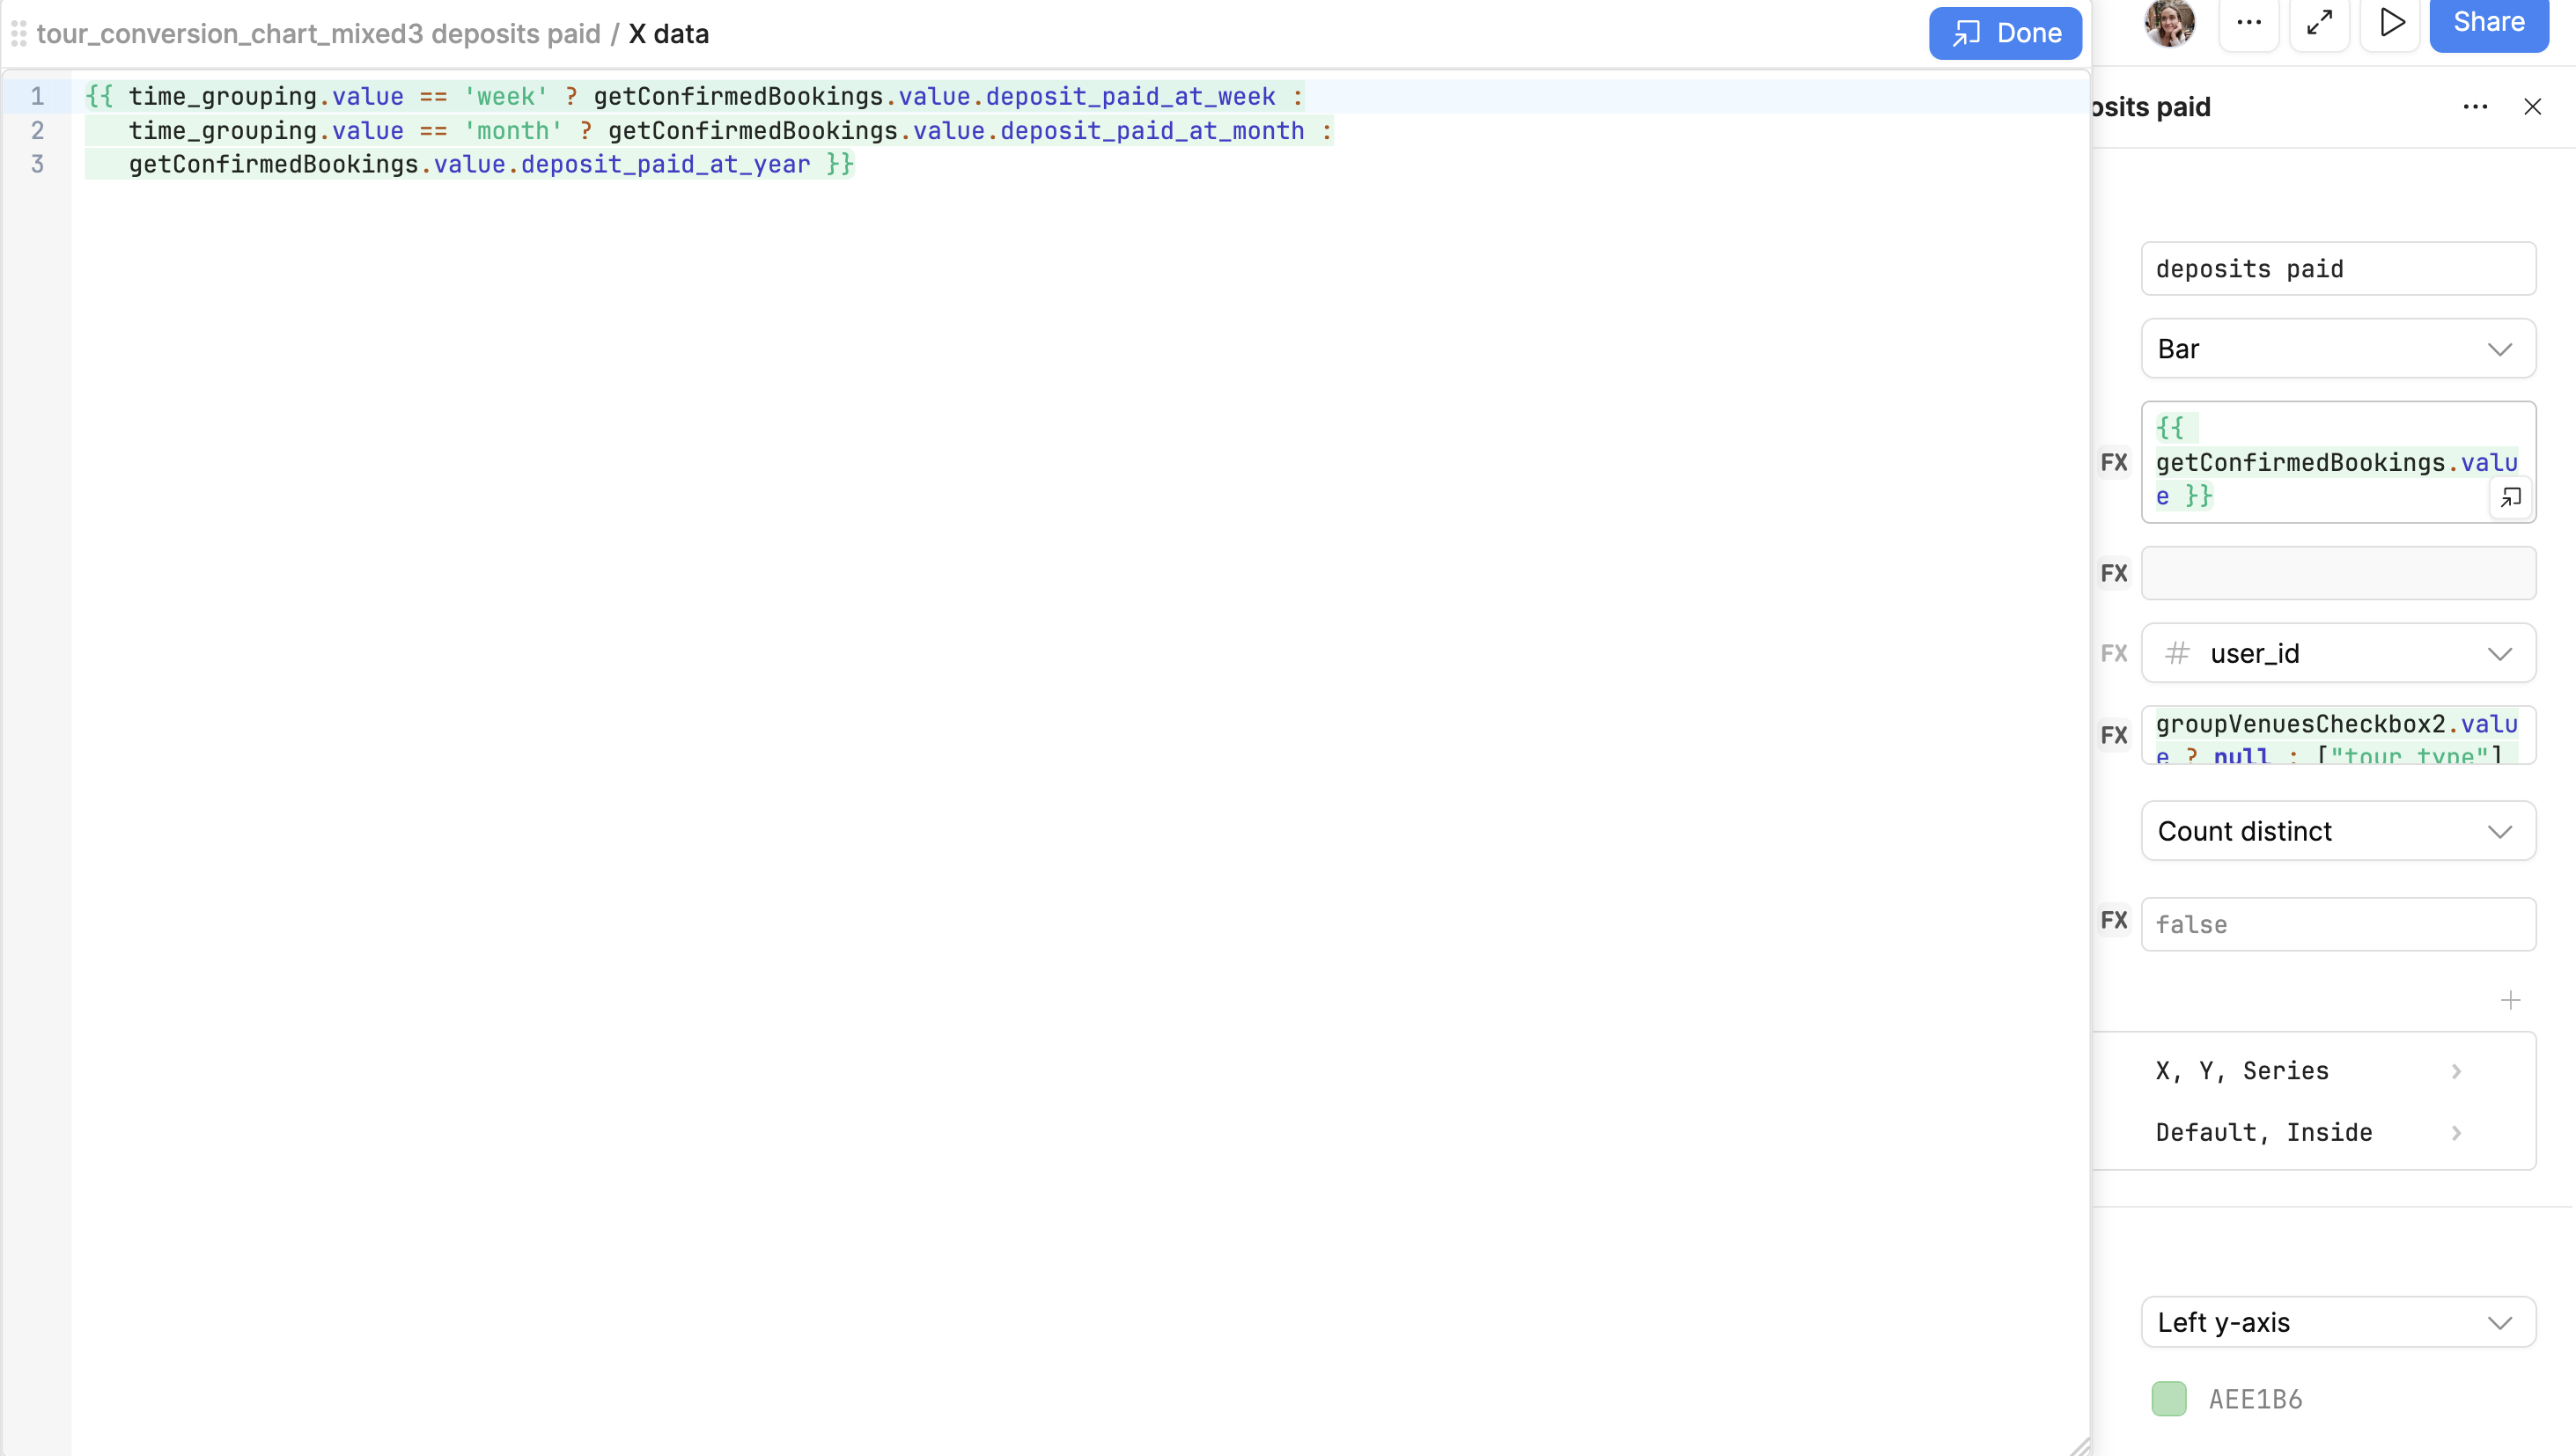
Details: My base query has all bookings and dates. I use a toggle to pick the date grouping -- to let my end user toggle between week/month/year (formulas in screenshot below).
- Screenshots:
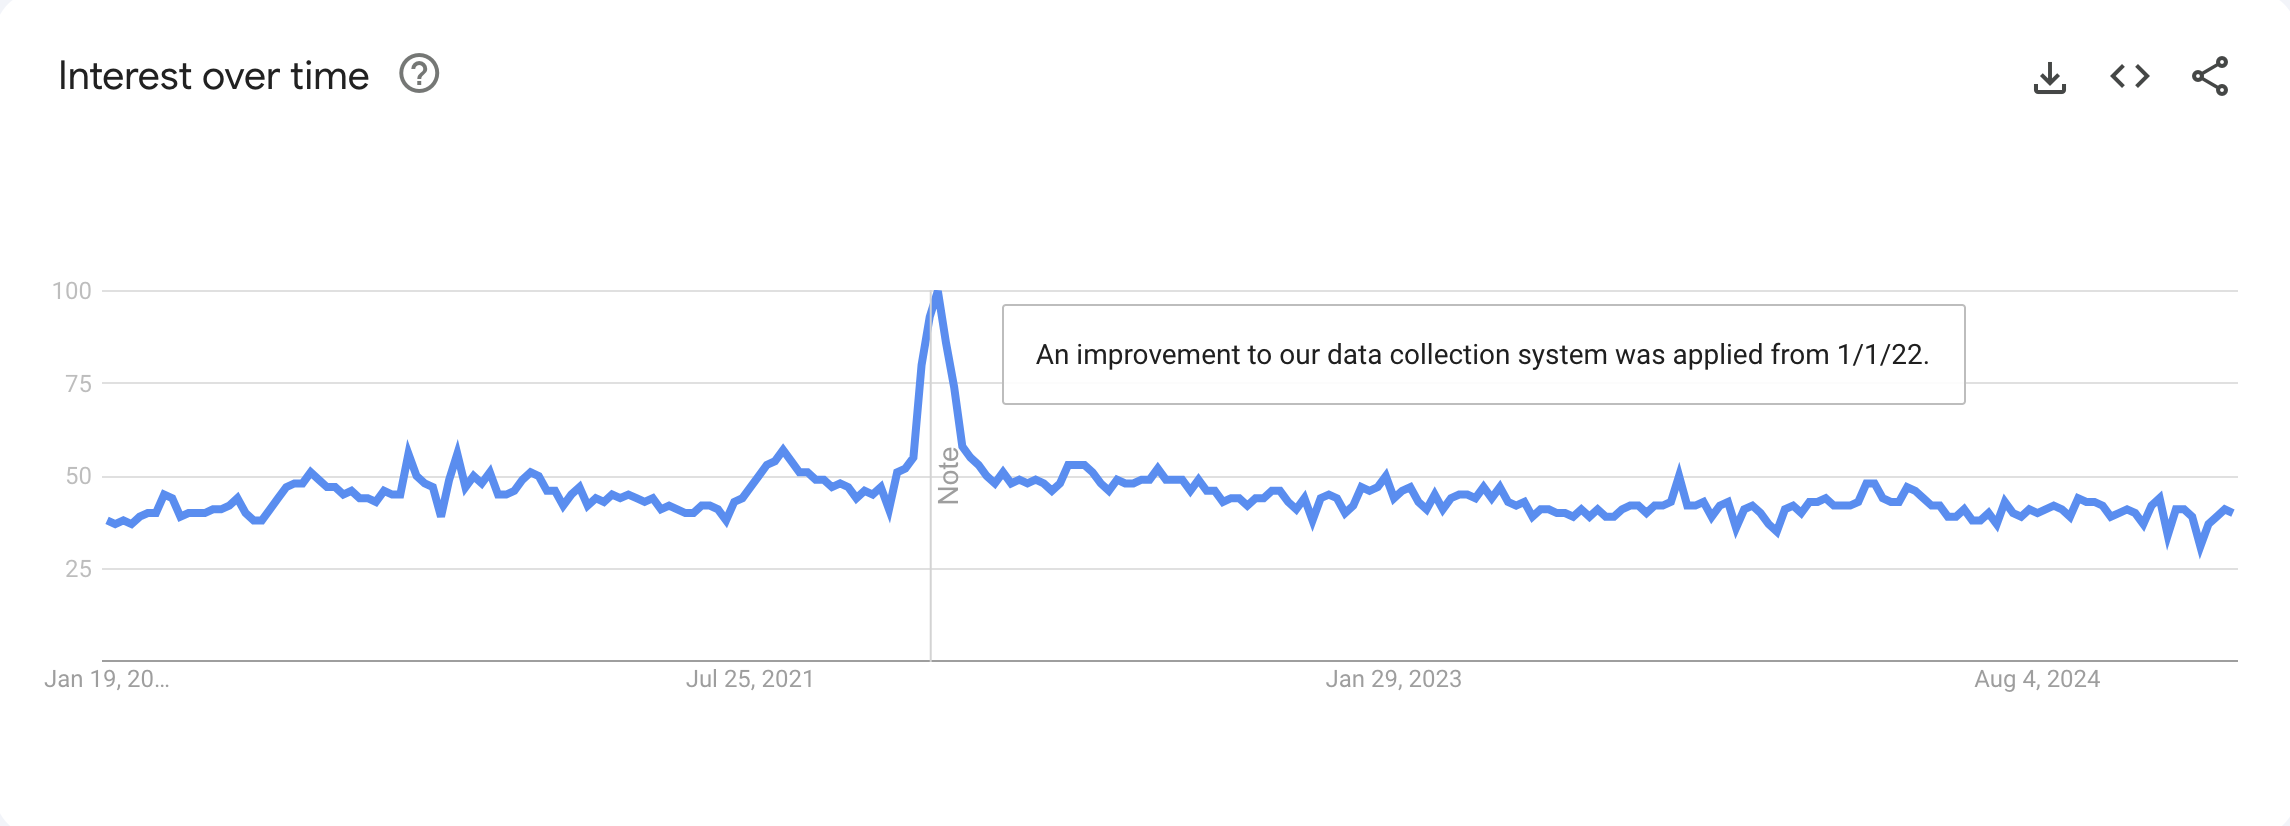
Here's an example of what I mean from a Google Trends graph -- where you can see the vertical line at a certain date, and see the note when you hover over it. I'm looking to do something like that, where the source data is a list of dates and annotations.