Hi guys, I'm new at retool and JSON, so this question might seem easy, but I can't seem to find a straight answer.
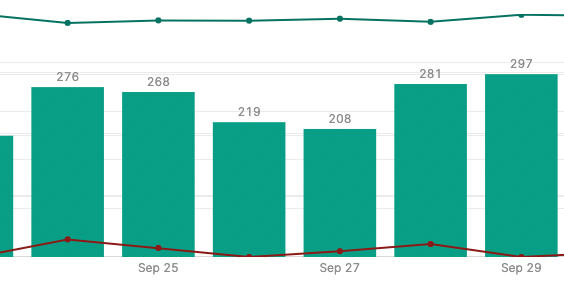
I want to add data labels to a combined bar+line chart. I've managed to add it to the bar (the first y axis), but when it comes to the line, I can't make it work.
For the first I'm using:
text: {{y}},
textposition: 'outside'
This works fine in the bar, but in the lines it doesn't. I went through the documentation but I can't find how to apply it to the line.
Bar code:
"type": "bar",
"text": {{y}},
"textposition": "outside"
Line code:
"type": "line",
"yaxis": "y2",
"text": {{y2}},
"textposition": "outside"
Thanks in advance!