Can't add vline to chart using plotly.js

Hi,

I have fairly standard time series line chart, and I want to edit the plotly.js to add a vertical line (vline).

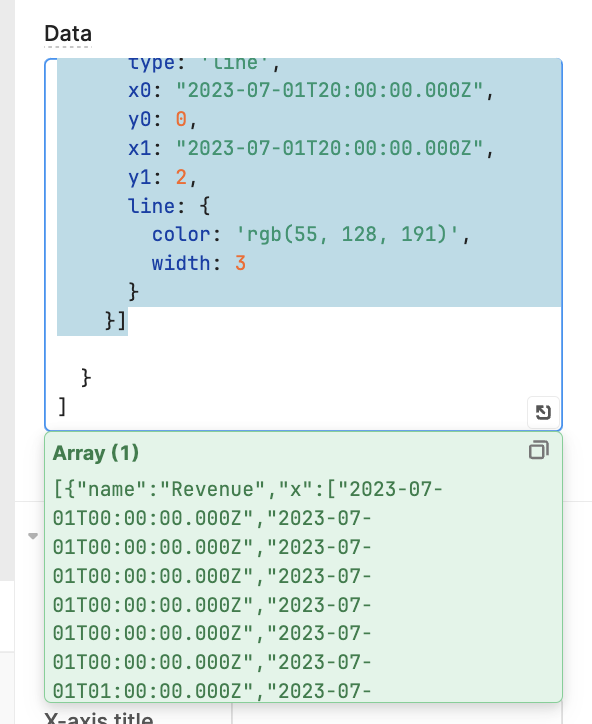
I think I should be able to do something like this:

shapes: [

    {
      type: 'line',
      x0: "2023-07-01T20:00:00.000Z",
      y0: 0,
      x1: "2023-07-01T20:00:00.000Z",
      y1: 2,
      line: {
        color: 'rgb(55, 128, 191)',
        width: 3
      }
    }]

or maybe something like this:

shapes: [{
    type: 'line',
    x0: '2000-01-11',
    y0: 0,
    x1: '2000-01-11',
    yref: 'paper',
    y1: 1,
    line: {
      color: 'grey',
      width: 1.5,
      dash: 'dot'
    }
  }]

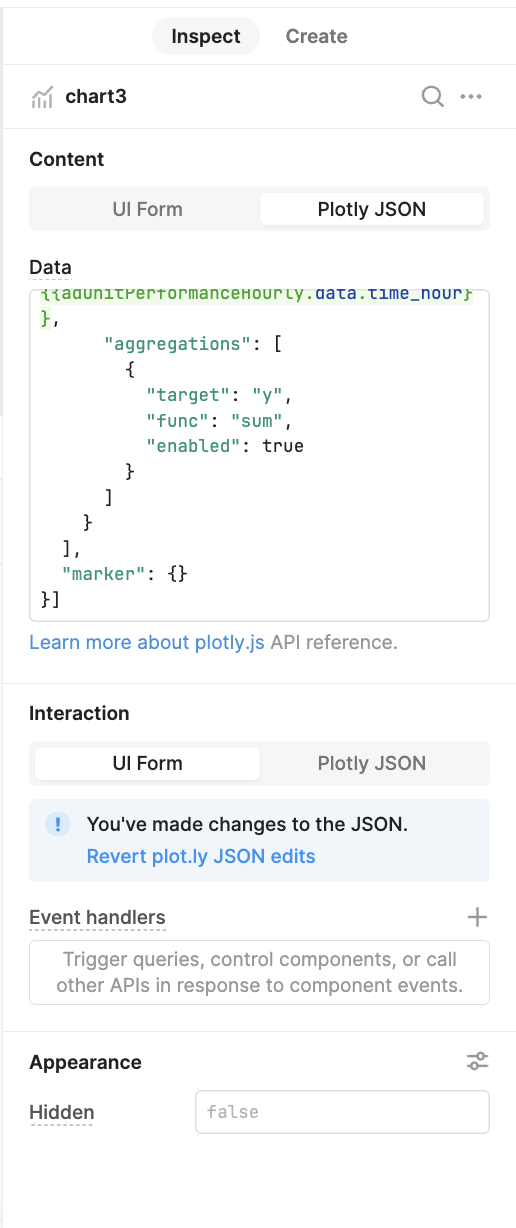
However, when I do this, Retool doesn't throw an error, but simply doesn't show the vline on the plot - see image below.

Does Retool's chart block support every feature in plotly.js? If not, it'd be great to see this communicated clearly.

UPDATE - after many hours of banging my head against the wall, I've figured this out. Posting so that nobody makes my mistakes.

Plotly.json involves two objects, data and layout.

In Retool, they're called Data and Interaction. I think the 'Interaction' name is to maintain consistency with other elements, but obviously is inconsistent with plotly.

So you need to add those vlines to the layout object, not the data object.

Pain.

1 Like

Hi @Henry14 I'm sorry to hear that it caused so much work on your end! But thank you for the feedback and for posting the solution :pray: