We have a workflow that runs once per day and brings data from a source to a destination.
We chose to loop over the entities and upsert them to the destination, since the same entity can be brought up multiple days in a row.
We started noticing at some point that some days the workflow fails, but we're not sure why, as there are no error messages printed or something.
We set up 3 retry attempts per iteration and 3 retry attempts for the entire loop and that still didn't resolve it.
Would appreciate any thoughts or ideas around how we can find out the reason & prevent it from failing again.
is there a chance using a 3rd party service might work to help tet some more logging info? Session replay integration
thats an example of how something similar could be added to a custom component for logging reasons, im still on vacation tho and am unable to see if theres a wayto implement somryhing similar in a workflow instead.
This issue still happens to us unfortunately. We tried many different approaches but we can't understand what's the reason for failure, as it's not a timeout or an error in the process.
It just "drops" the process in the middle, kind of.
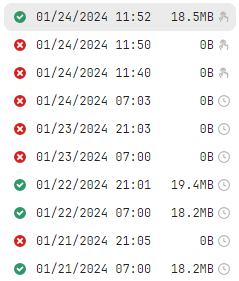
These are our recent runs - as you can see we saw that it failed multiple 3 times in a row so we went ahead and manually triggered it - where it again, failed twice, but on the third attempt it suddenly succeeded.
The data itself is identical in the last 3 triggers so we can't see any reason why it would fail the first 2 times.
The first run failed after 56.87 seconds, the second failed after 43.256 seconds, and the successfull run took 101 seconds in total - so we can clearly see that the runs are dropped in the middle of the process...
Im currently facing the same issue with workflows (specifically when I have AI blocks).
When I run blocks individually, everything is working fine and nothing time outs.
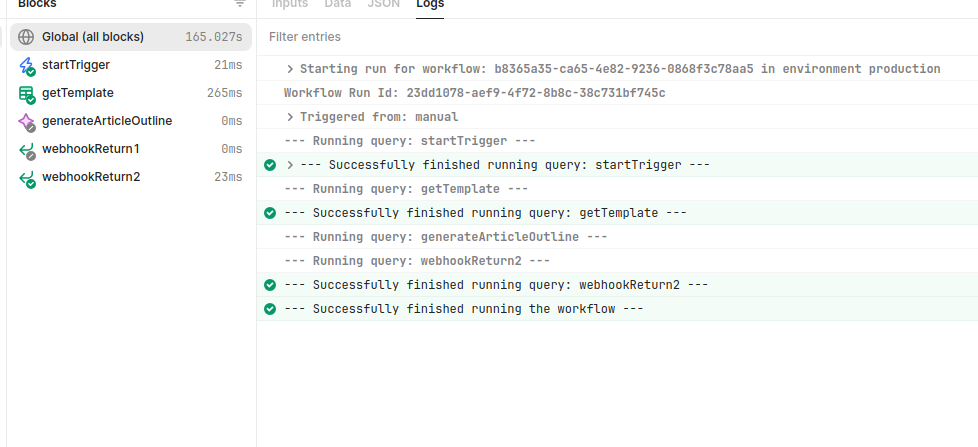
However, when I try running all the workflow (from the app and the workflow bar), it just fails. Tried adding global error handling to debug the issue, nothing shows up.
Yep, this is exactly what I'm facing, and I found no possible way of debugging it or understanding why it fails.
The fact that the workflow is unstable is bad on it's own, having no way to debug it or understand what makes it fail is terrible.
I hope someone from the support team somehow gets to this topic, since I had no luck when contacting them by mail.
@Shai-D I noticed that AI blocks are the ones failing without reason. I was able to partially achieve my goal by using pure python along with open ai library. The downside is that you won't be able to leverage the Vector store.
it could be a pain in the butt, but you could use the OpenAI Assistants API to create an Assistant w access to the 'Knowledge Retrieval' and 'Function Calling' tools to achieve the same thing. since in the background Retool Vectors uses the Embeddings API ur results shouldn't be much different, if at all, so u can easily switch back to the Retool AI resource if u ever decide to.
Unfortunately I am not even using any AI blocks or something like that in my workflow, its a purely deterministic workflow, and it's not even that complex
Yuke has reached out to me by email, we will try to debug and understand what's going there and I guess one of us will update here if we have any smart things to add
So apparently the issue was that the workflow has run out of memory and crashed
We optimized the workflow to use less memory and generate less logs and stuff to try to reduce the memory usage and it now works.
Basically in the past we were iterating over ~10k records, upserting them in a loop one by one.
Now we are batching them, 10 batches of 500 records at once, which makes it more efficient
I know this is much later but I think this information is useful for future people who find this page.
Seeing here that workflows just stop if they run out of memory made me consider changing all of my loops from "Parallel" (which is the new loop's default) to "Sequential" and add a small iteration delay. This makes the workflows run for longer, but it also seems to reduce the memory used at once, fixing the issue.
Just to add to the list of things to try when attempting to use less memory. In my opinion it can be easy to overlook some of the simple things we all stare at without much thought, especially now-a-days with many GBs of mem at our fingertips. for example, the amount of unused data being returned after EVERY block. choose to annoyingly type out every column name you need just so you can save space by not wasting it on column values you never use or care about.
SELECT * can be evil and it can add up, especially if you have a large dataset returned in 1 block, the same sized dataset afterwards being processing and returned in a 2nd block, then the return object for the workflow response uses a 3rd copy. what was initially a single object with 5k rows, is now 3 objects with 5k rows. consider using functions to prune datasets before ending a block (this might mean converting a loop to js so you do mid loop processing or something) this also means the more blocks that you run, the less 'working space' the next block has to complete it's task.
with a shrinking memory pool, long lasting loops or loops with inefficient memory usage should be performed as early as possible. this might mean having to split loop logic so the memory intensive stuff is returned from a much earlier block which will increase how long the process will run with a higher memory profile but if all code after allocating the memory for larger stuff earlier is overall less memory intensive then you've successfully lowered your odds of over-allocating by pre-allocating
not all built-in functions you can use on Arrays, Objects and strings are the same even if their description makes it sound like they are. careful of things like .map(), .filter() and .concat() [or the + symbol when datatype is relevant] return copies of the array or object used as input/parameters... so if you called .map on an array with 10k items, now you have 2 arrays with 10k items in memory.
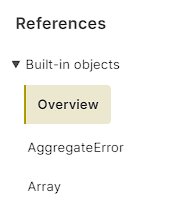
here's a cheat sheet of sorts that's easy to glance at and get what you need. otherwise you want to focus on the Instance Methods section on the left here for arrays, objects here and strings there. those will be the most common types you'll be dealing with, other types can be found here though, just scroll up and down on the left looking for this section:
here's an example of what you're looking for when you do find a method that you're looking for or one that sounds like what you're looking for:
Anyone figure this out? This suddenly started happening to us today out of nowhere. All workflows with API requests time out. There is nothing wrong with our API endpoints, they run fine when you manually hit them and our logs don't even show that Retool is attempting any API request. So Retool says the API request timed out, but Retool didn't even make any requests. When we run the Workflow manually everything works fine. Very strange. Just started happening this morning. Seems like Retool just gets hung at a workflow step and doesn't even attempt requests.
Hey @ddsgadget! I just realized that your post here was never directly addressed. Are you still having an issue with your workflows?
The original issue described above was ultimately caused by excessive memory use and primarily solved by batching requests, but it doesn't necessarily sound like the behavior you're describing is related. If that proves to be true, I'll break your post out into a separate topic.