My goal: Get a visual depending on the summary row
Issue: Can’t find a way to address the summary row
Steps I've taken to troubleshoot: So many different lookup in the way table1 is done
Additional info: (Cloud or Self-hosted, Screenshots) Cloud version
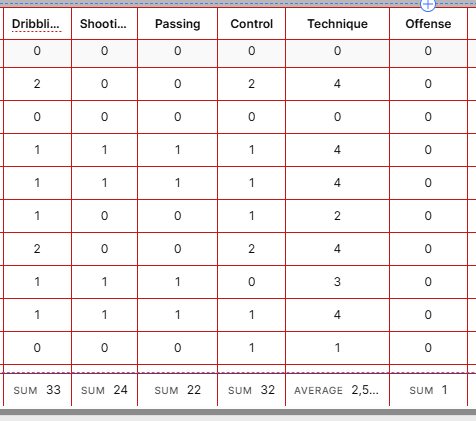
The purpose is have a table where I get different integer values. I am then using the summary row to show the average for this column. My purpose is to change the background color of this column “Technique” depending if it is under or above the average of this column. For example of over I would put the cell green and if under I would show it yellow.
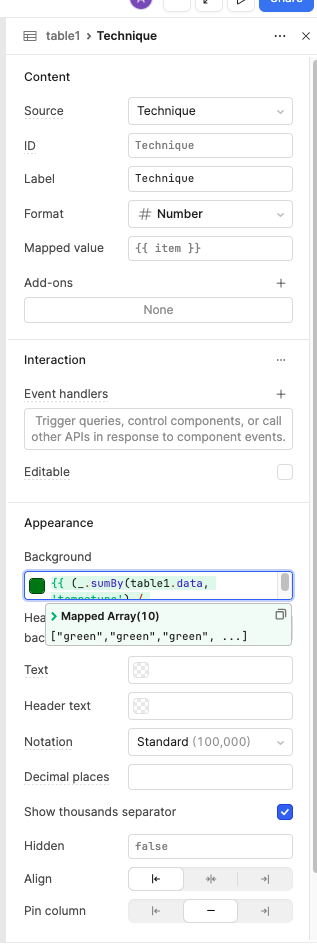
Hey thanks ! In fact what I discovered is a computed column is not available in the tableX.data so I had to create a real column in my database Here was the final comparing to the item instead of 5 as you mentionned. tottech is the column name/id
{{ (_.sumBy(table1.data, 'tottech') / table1.data.length) > item ? "yellow" : "green" }}
Thanks for posting on the Retool community forums. My name is John and I will be assisting on this dynamic cell coloring.
I can see WildeStudios and your comments and these appears to be the most straight forward approach. It has a check that adjust's the color based on the sum.
Beyond what has already been shared here, is there anything else we can do on this request? If no, would you mind marking yours or WildeStudios comment as the resolution?