I have a retool new table which populates data from a query whose columns will vary based on the query results. I have used Dynamic Columns and the outcome is perfect. However,
When downloading (as CSV) the headers are missing
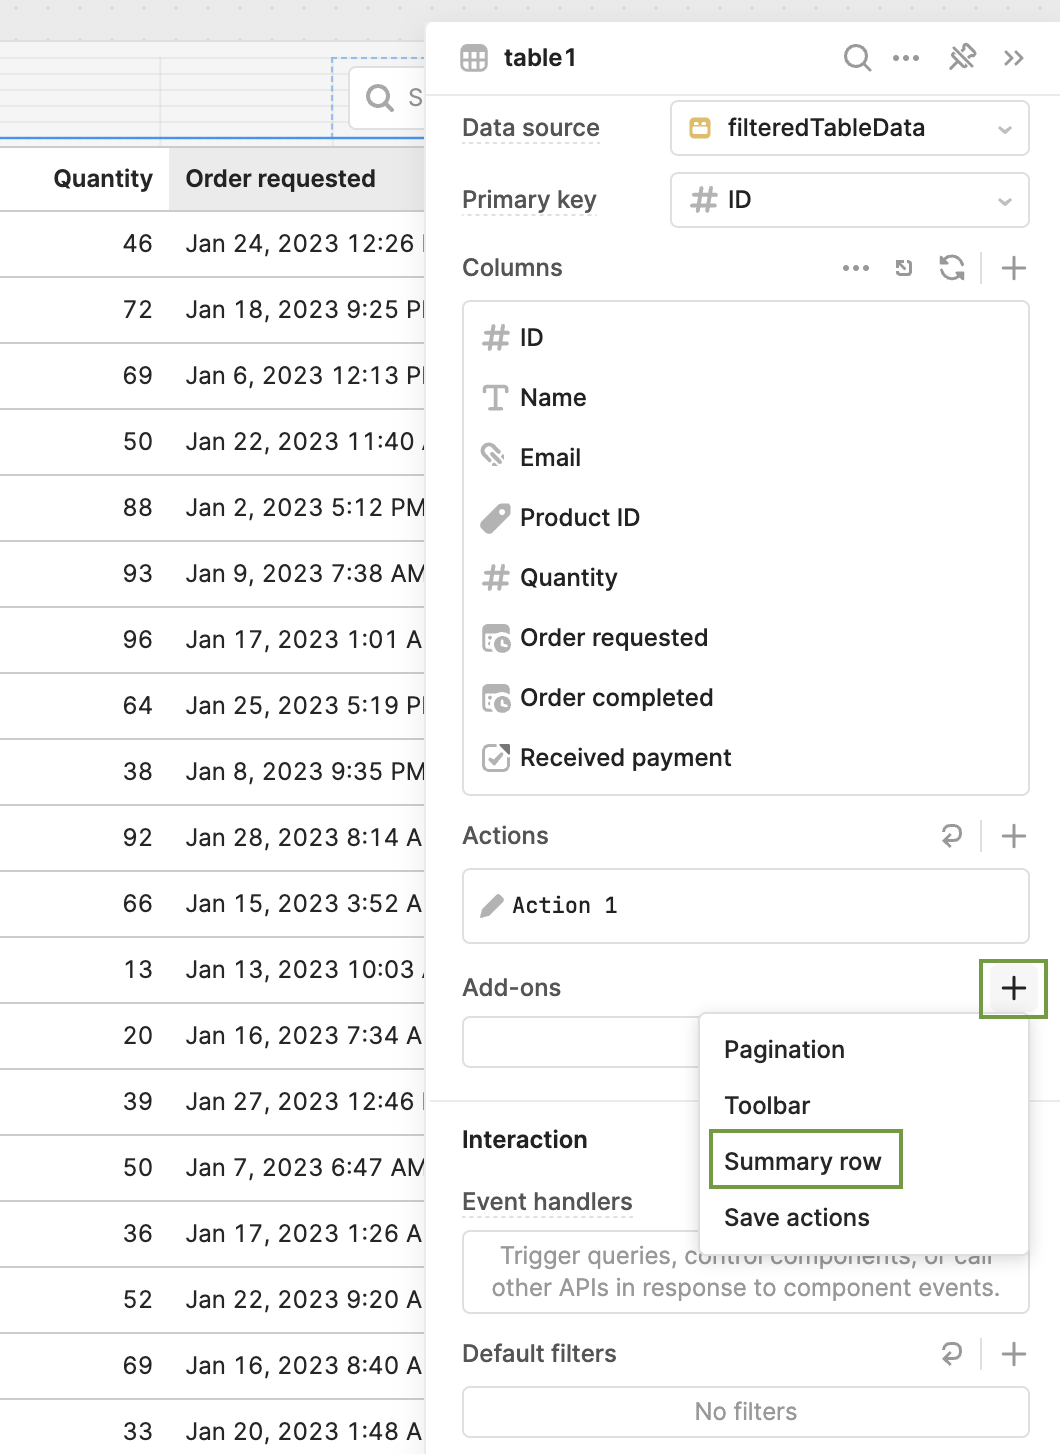
Summary rows when added has no summed up values on the dynamic columns
Is there a way to get sum of row values by adding a additional fixed column
Thanks
This is a known issue on our end that we have a bug report for. We don't have any expected timeline at the moment, but I went ahead and linked the report to this thread so that if there are any updates we can let you know!
Yes, Retool's table component has a Summary Row feature that you can read in more detail about on this post.
Thanks, Sivaram. I just made a request for this feature and will let you know of any updates!
I'm not sure what your use-case is, but it might be worth mentioning that if a column appears in two tables, you can opt out of listing it dynamically. In that case, one would be able to have a summary row for that particular column. Hope that helps!
Thanks for making the request.
As mentioned in my request, the use-case is : Table which populates data from a query whose columns will vary (for each run) based on the query results. Hence, it will have to be dynamic.
I, too, have a use case for having summary rows (plural) for some data.
My data looks like this:
Category
Sub-category
Y-1 Q1
Y-1 Q2
Y-1 Q3
...
Y-n Qm
cat 1
sub 1-1
10
20
30
...
60
cat 1
sub 1-2
10
20
30
...
60
cat 1
sub 1-3
10
20
30
...
60
cat 2
sub 2-1
100
200
300
...
600
cat 2
sub 2-2
100
200
300
...
600
cat 2
sub 2-3
100
200
300
...
600
cat 2
sub 2-4
100
200
300
...
600
In this table, the columns are dynamic. We need to fetch data that falls into whatever date range the user specifies, then display them by year and quarter. This could be 1 quarter, or many quarters across many years.
Each row belongs to category. I want it such that when I group the rows by category and hide the details (i.e. sub-categories), I want the table to look like the following:
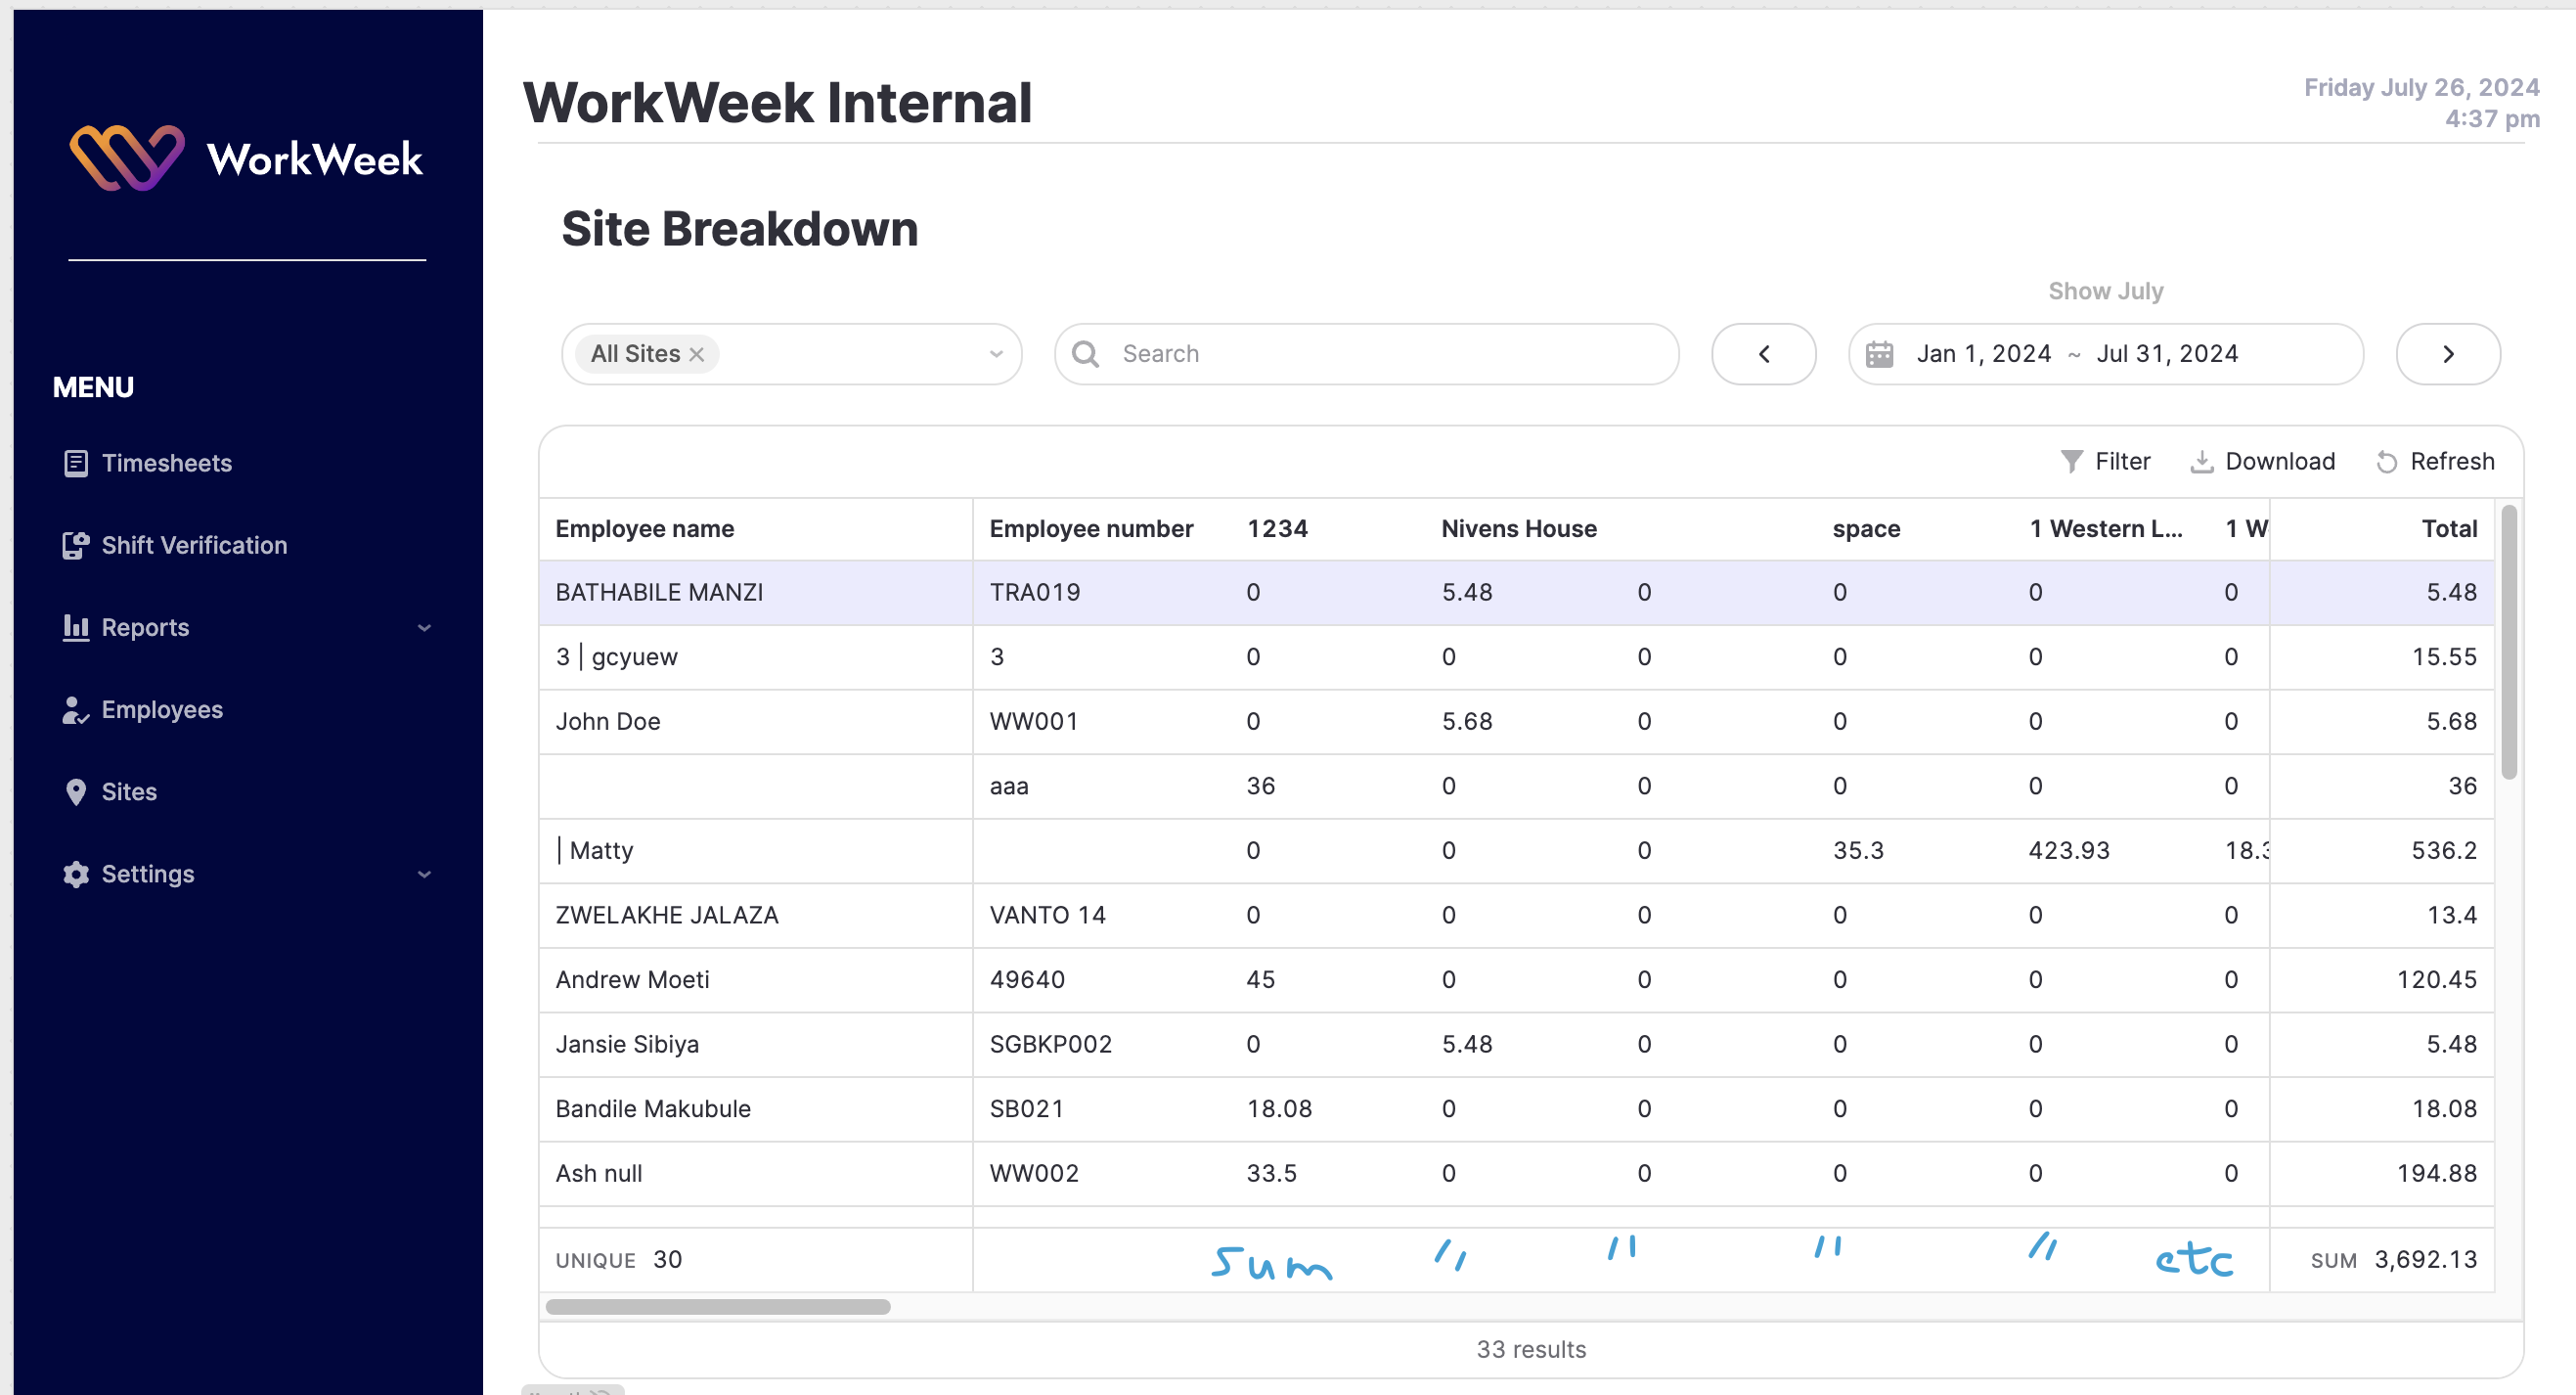
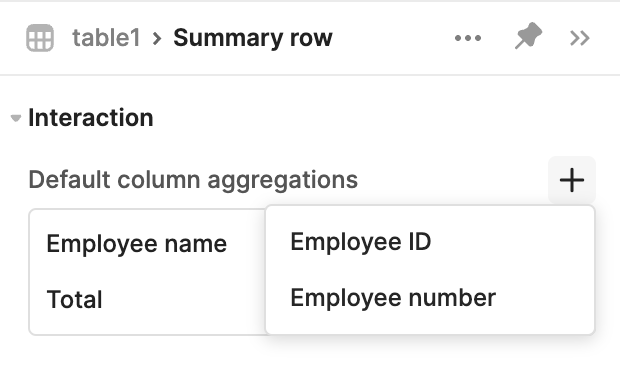
I have dynamic columns that ALL need a SUM summary row!
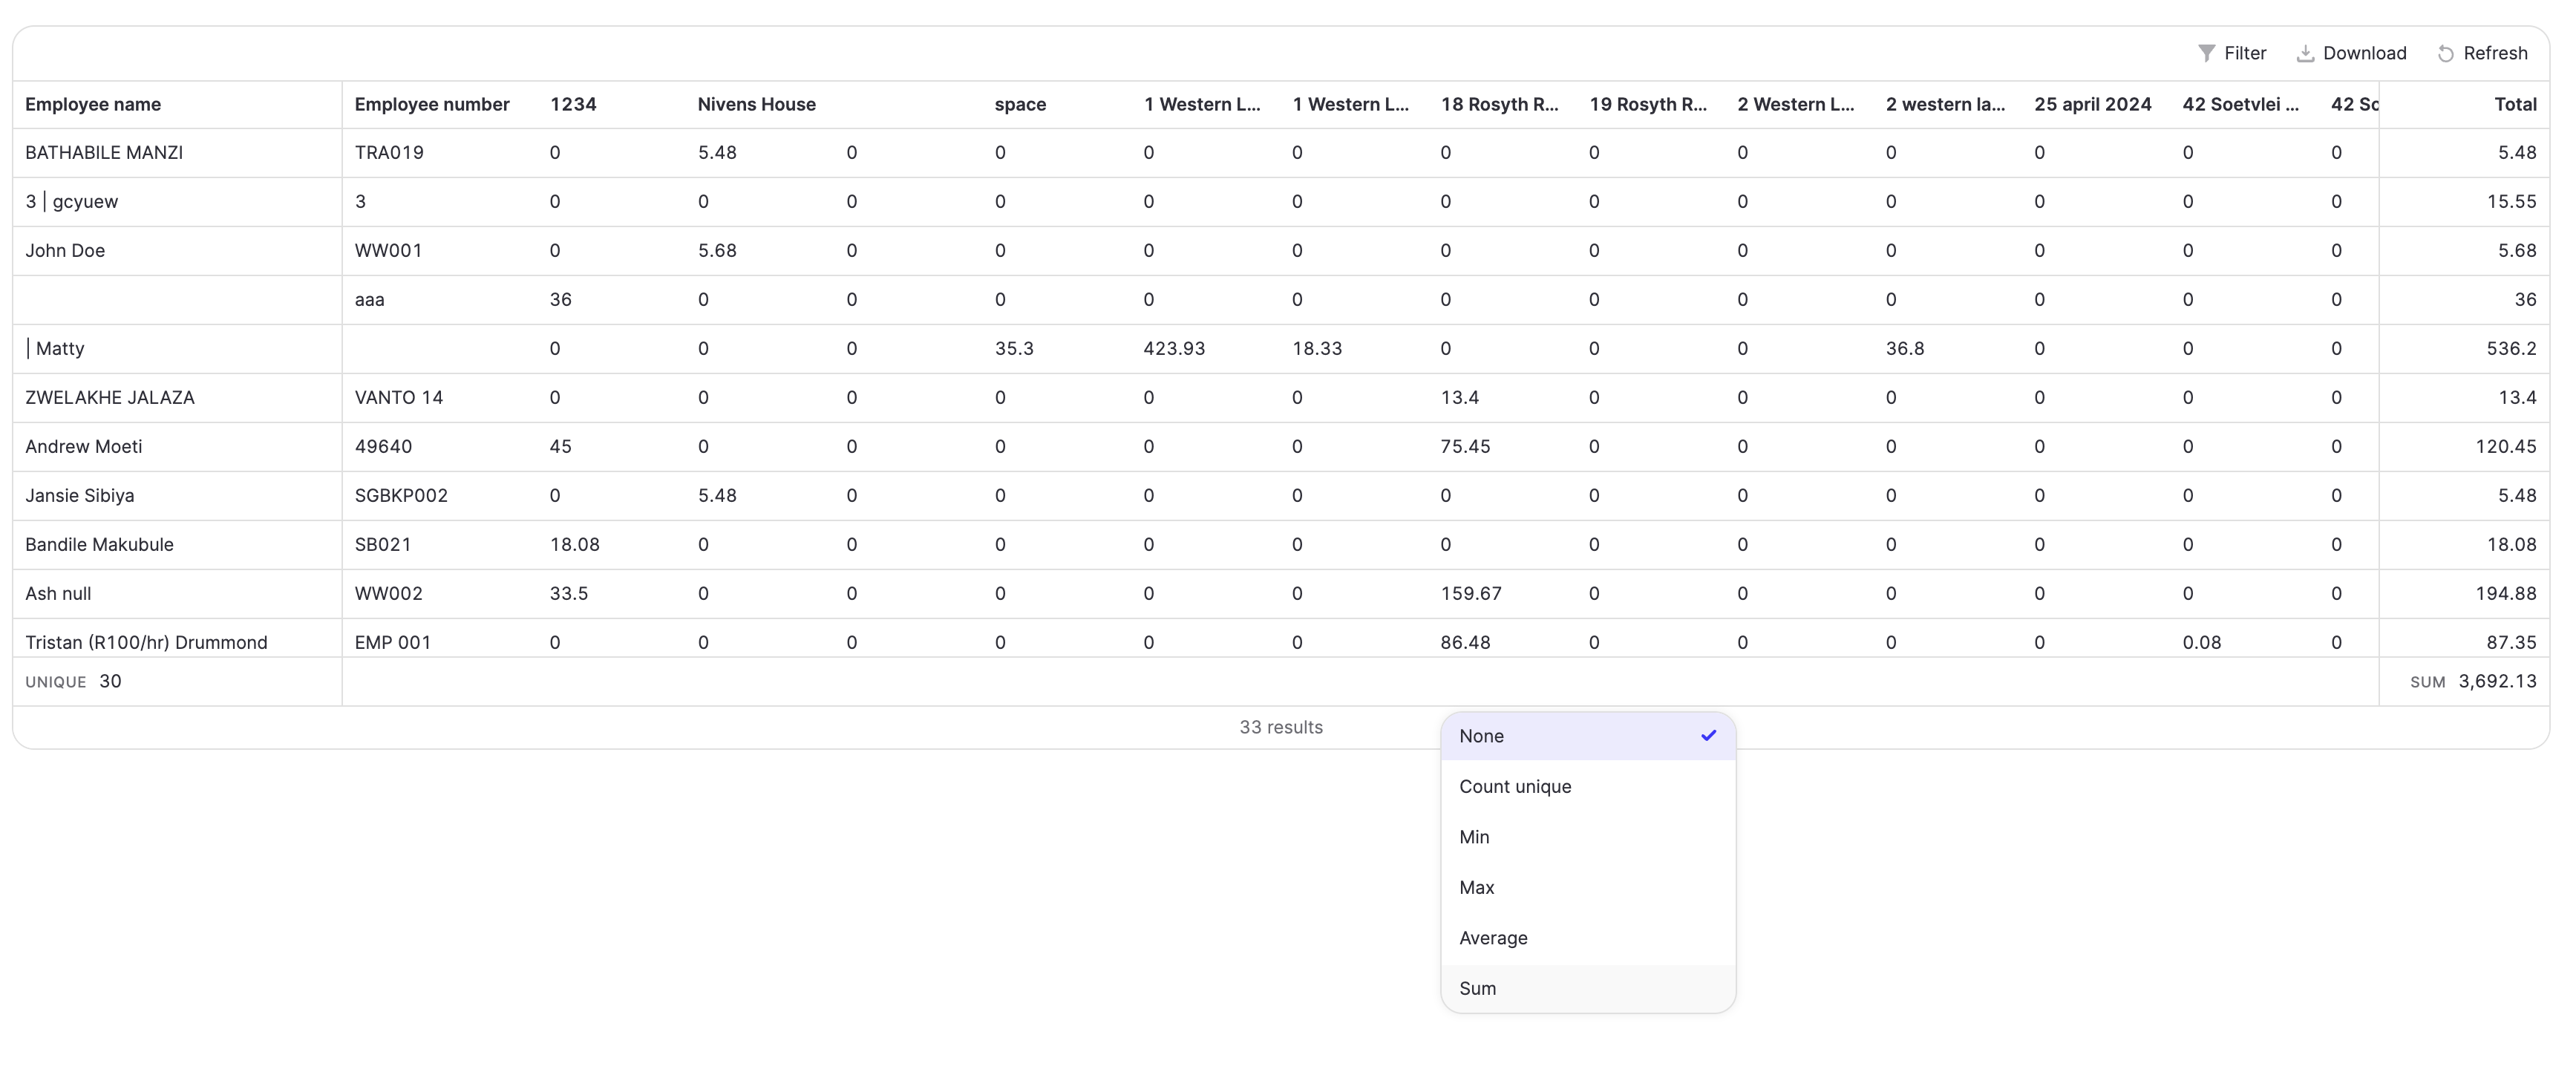
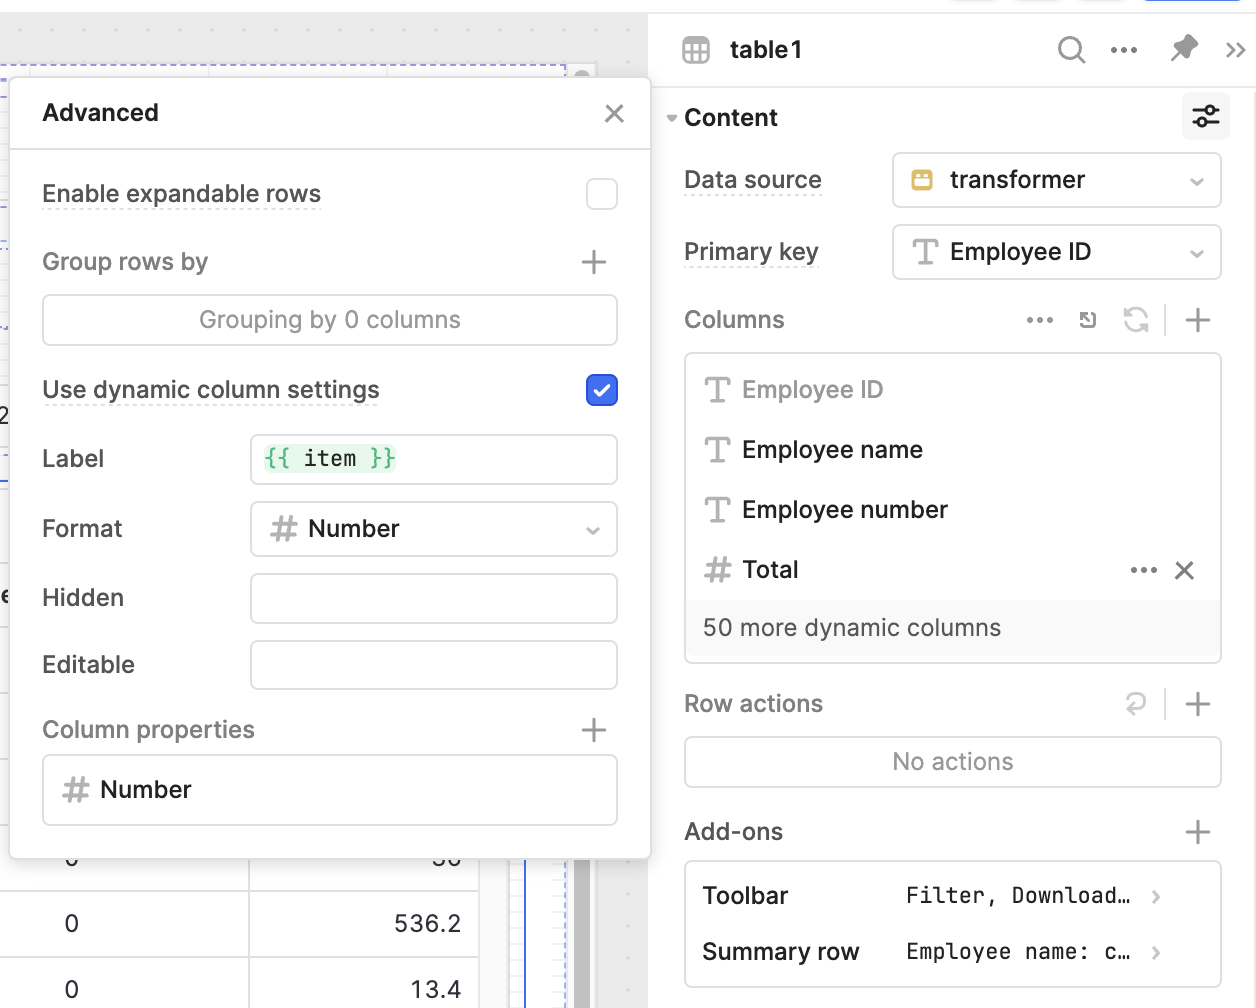
I've also just realised that there is actually a BUG with using the Summary row with dynamic columns...I can't select the type of summary I want! (cc @AbbeyHernandez, can you recreate?)
Clicking on any of the options yields no change in selection (it's stuck on "None") for all the dynamic columns.
This is also ESSENTIAL for totals that update when filtering (if you do it in JS, we can't update the Summary row based on the search term or filters)
@Van show some support here, I know you'll need it!
The workaround of 'calculate your own summary row in JS' isn't cool because then the row doesn't freeze, and you'll then have 2 summary rows if you want to use the built in feature.
My use case is similar—I have forecast data for an inventory management system with multiple warehouses. The user can select the forecast granularity and duration, so the columns need to be dynamic. However, I want to group the rows by warehouse and include a summary row that shows the total in-stock amount across all warehouses!