- My goal:
- I’d like to change a cells color in my table if that particular cell has been manually updated.
- My table consists of skus we sell on Amazon and i’ve used a transformer to show weekly sales in individual columns.
- I’ve set up a rule already where if a user manually edits a cell for a particular week, it shows up on a new table and that particular sku/week gets flagged.
- I’d like to pull based on the flagged sku/weeks…put in some logic that says IF the sku/week has a flag then change the color to light blue (color doesn’t matter)
- Issue:
- I need this to be done at the table level as i have 100+ columns that show weekly sold units. I know how to do this at the column level but considering i have 100+ columns and a new one added each week, it’s not feasible to do it at the column level.
- Claude cant do it, chat gpt can’t do it, even the AI tool directly in retool says theres no table level formatting for this.
- Steps I've taken to troubleshoot:
- one workaround if round is adding a little emoji in each cell but that means i have to change the cell to a text value and that wont work for sorting purposes.
- Additional info: (Cloud or Self-hosted, Screenshots)
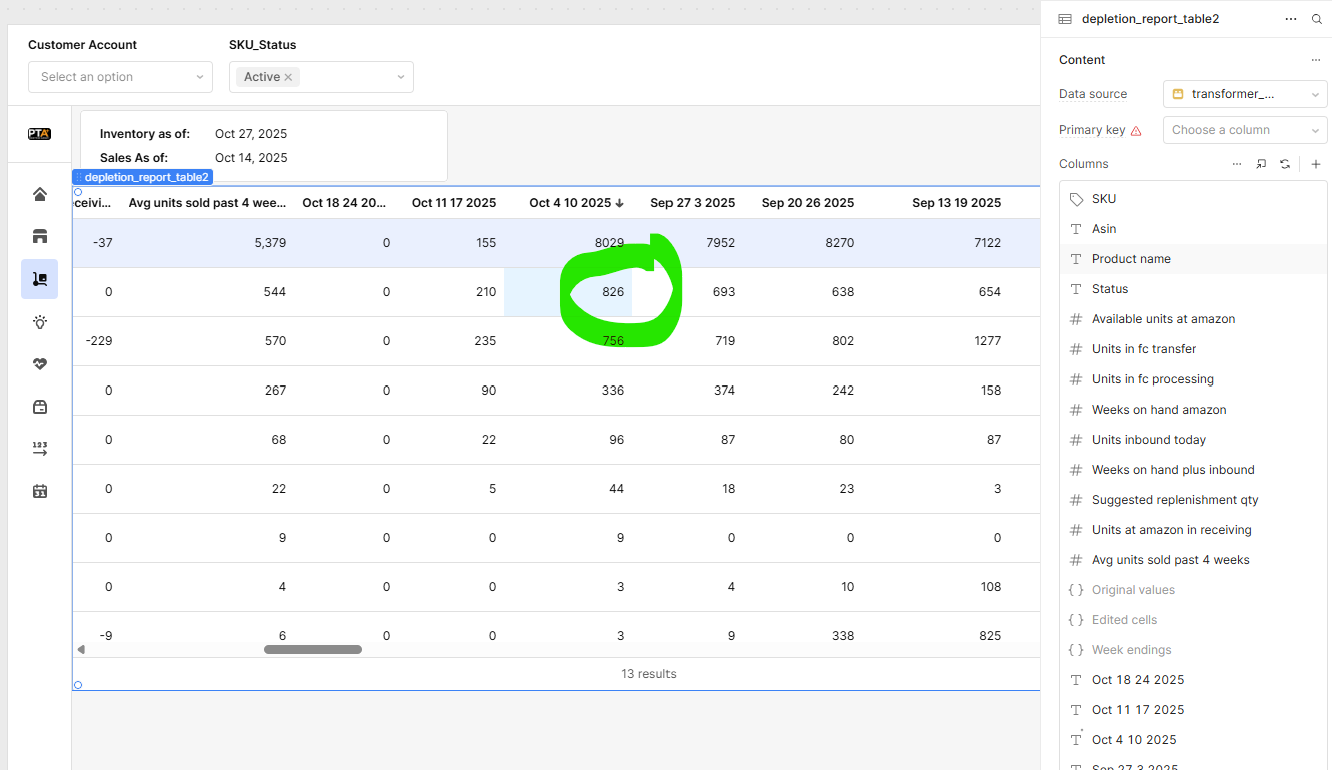
- below shows the cell i’ve manually edited. i’ve already set up a rule in the column to highlight it blue…which is working. but as i said above, i have 100+ columns. so this is not a good solution.
- below shows the cell i’ve manually edited. i’ve already set up a rule in the column to highlight it blue…which is working. but as i said above, i have 100+ columns. so this is not a good solution.
1 Like
Hey @bsmallPrimeTeam , welcome to the Retool community!
I totally understand what you’re trying to achieve — you want to dynamically change the background color of a specific cell when a flag or certain condition is met in your data.
You can easily handle this using a conditional expression inside your table cell’s background color field. Here’s an example you can test with:
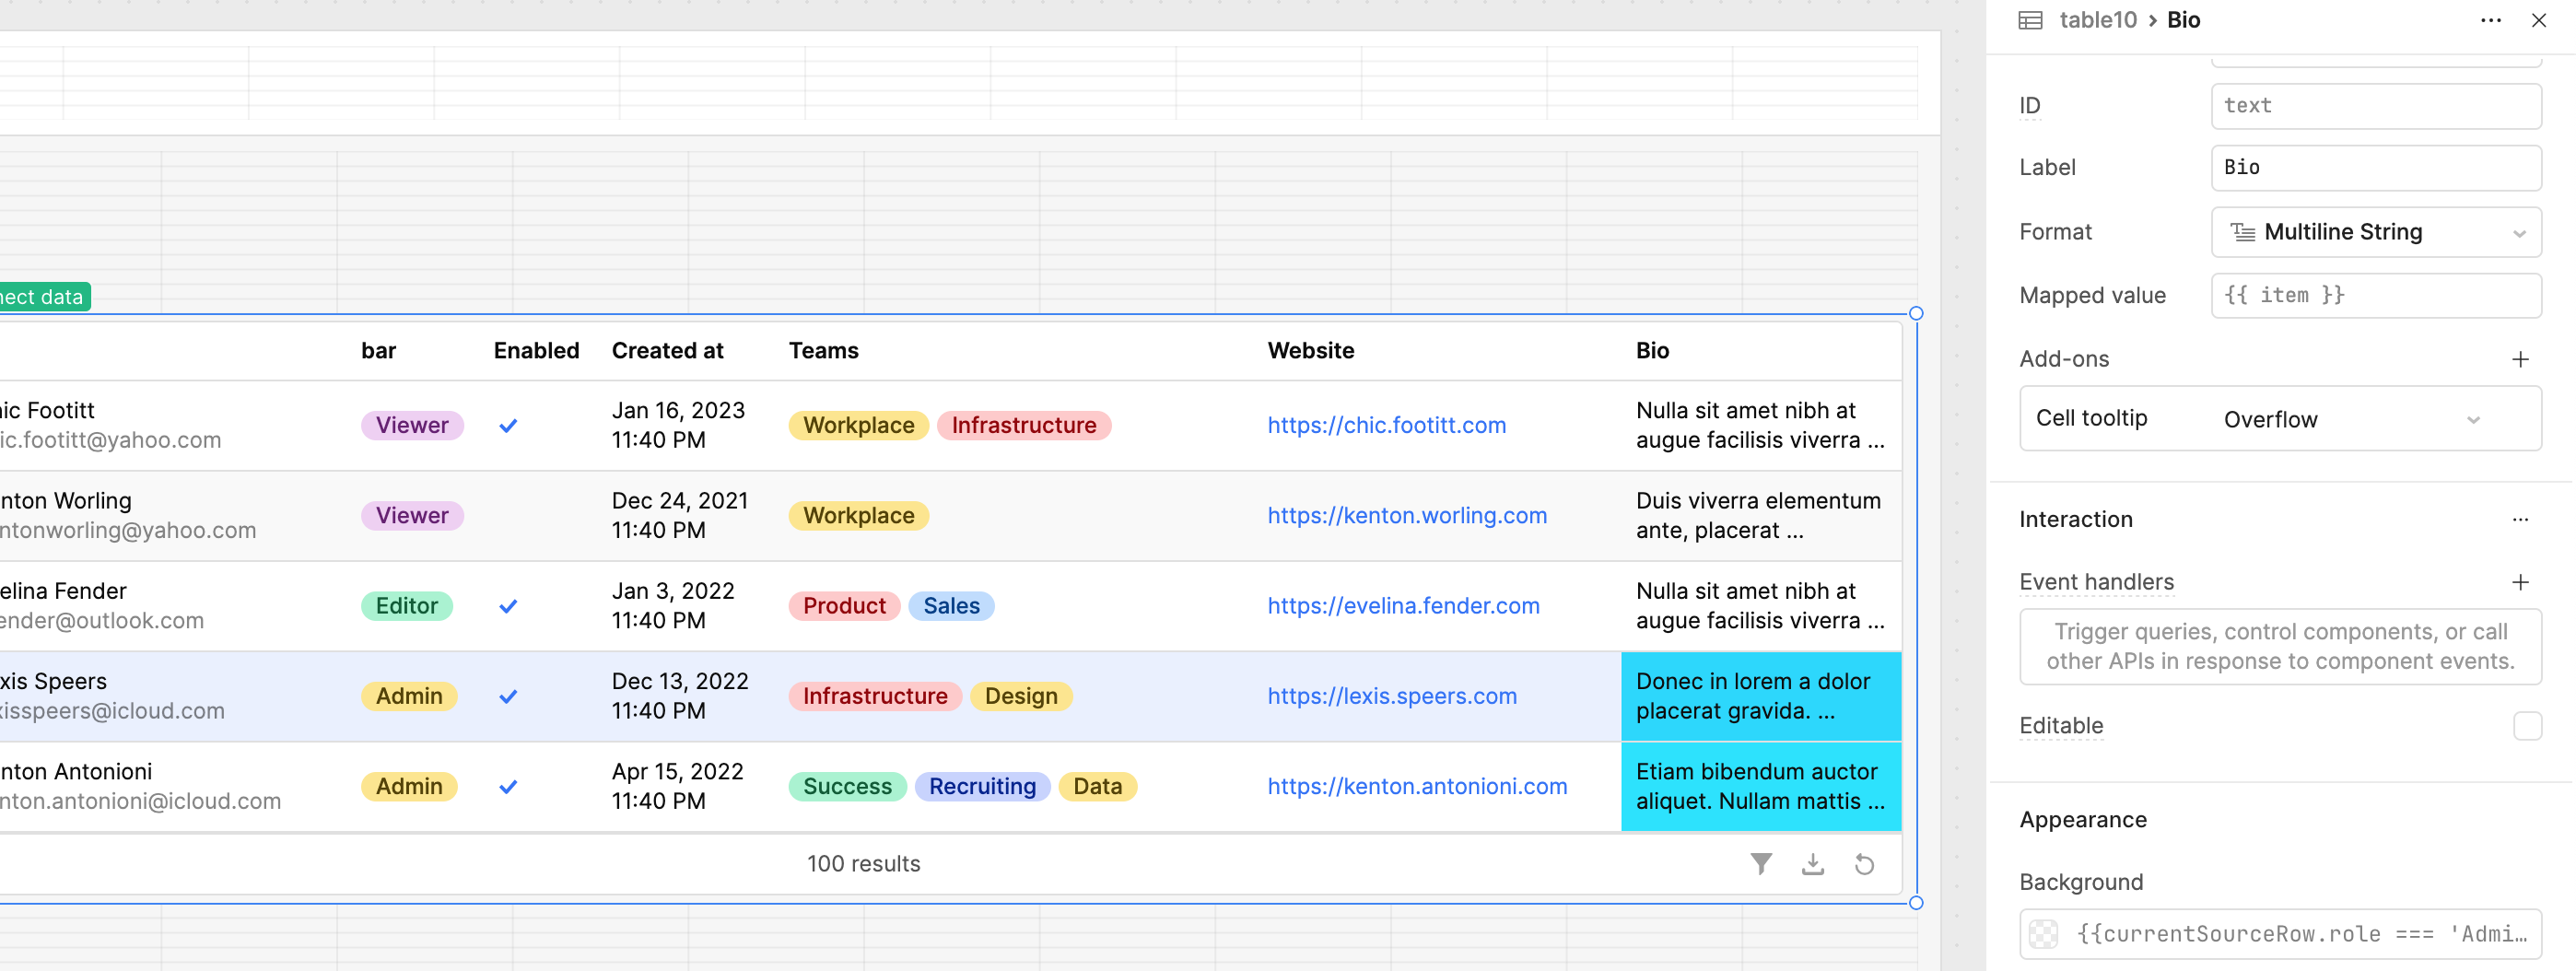
{{currentSourceRow.role === 'Admin' ? '12E2FF' : ''}}
This will automatically apply a light blue (#12E2FF) background color to any cell where the role value equals "Admin". You can, of course, replace the color code or the condition as needed to match your use case.
I’ve also uploaded a screenshot for your reference so you can visualize how it looks in the Retool table:
If you’re flagging multiple rows based on different conditions (for example, role, status, or flag), you can use nested ternary operators:
{{ currentSourceRow.flag ? '#FFDDC1' : currentSourceRow.role === 'Admin' ? '#12E2FF' : '' }}
This gives you more flexibility for multi-condition styling.
Hope this helps you get the desired visual effect in your table!
3 Likes
hello @WidleStudioLLP thanks for the feedback! I noticed your screenshot has the column Bio selected and you put in the conditional expression in the cell background color for that specific column. While that does work, unfortunately it’s not practical for my use case. My table is going to show weekly sold units on Amazon and each week a new column is added. I’ll need to come up with a way to where this conditional expression is done at the table level. Each week a new column is automatically added, I don’t want to have to go into each new column and add this conditional expression.
do you know how this can be done at the table level? If not, is there a way to apply a conditional expression to each new column automatically each week?
1 Like
Hey @bsmallPrimeTeam ,
I totally understand the issue you’re facing. Unfortunately, there isn’t any built-in property within the Styles or Dynamic Column Settings of the Retool Table component that allows you to conditionally change a cell’s background color based on a specific condition.
However, there’s a good workaround!
If your table is meant for view-only purposes (i.e., you’re not performing actions like editing, clicking events, or triggering queries from it), you can switch to using an HTML component. With a custom HTML table, you’ll have full control over the structure and can easily apply conditional styling using your own CSS and logic.
Also, I noticed that you’re currently using a Transformer instead of dynamic columns — that actually makes this approach even better. You can directly pass your transformed data into the HTML component, and then handle all the display logic and color conditions there.
This method gives you much more flexibility for UI customization and keeps your setup clean if you just need to display data visually.
Hope that helps!
Let me know if you’d like a sample HTML + CSS snippet to get started.
4 Likes
Have you thought about flipping (pivoting) the table data in your transformer? Make each week a row, so then you would only need to apply the conditional formatting to the “sold units” column. Not sure if that works with your data setup, but might be worth a try.
1 Like
Hi @bsmallPrimeTeam,
Unfortunately there is no native way to do this, but I can make a feature request for table level logic to check if cells meet a condition, to then be able to apply a styling.
What were you thinking would me the mechanism to let the table know a cell has been manually edited?
I was thinking there may be some way to use JS logic to check what rows/cells are in the changesetArray but you would have to manually add that logic to each column.
Currently, if you have the table with 'all columns set to editable' when a cell is edited it will have a blue corner sliver, until it is saved. Where you can define logic in the save event handler to potentially run some logic to style the cell after the save event occurs ![]()
thanks @Jack_T - that would be great if this feature could be added. as for how to let the table know there’s an edited cell, I have a specific table in my database that keeps a record of all edited datapoints that the retool database pulls from. so if a give cell meets a criteria…for example if SKU 123 and week#47 are in this new table…that means it’s edited.
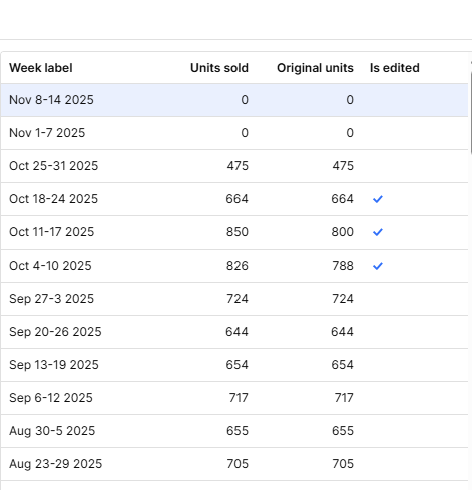
I’ve come up with a workaround solution…instead of the table highlighting each cell thats edited, i created a modal that has a unique table inside of it. as you can see it clearly shows which weeks have been edited.
even though I have this workaround…would still be good to have the main table in retool highlight the cells a certain color
Hi @bsmallPrimeTeam,
Thank you for the additional details on the set up.
That is a really clever work around! It just got me thinking if there is an 'is_Edited' column that holds boolean logic for the state of a cell being changed or unchanged, maybe the table could be set up with row level styling for when that boolean is true ![]()
Will keep the feature request for a native solution ![]()