Hi @ferret141,
I'll be running a demo test in my app. You might want to try creating a transformer and use its output to set the color array in the pie chart's color section.
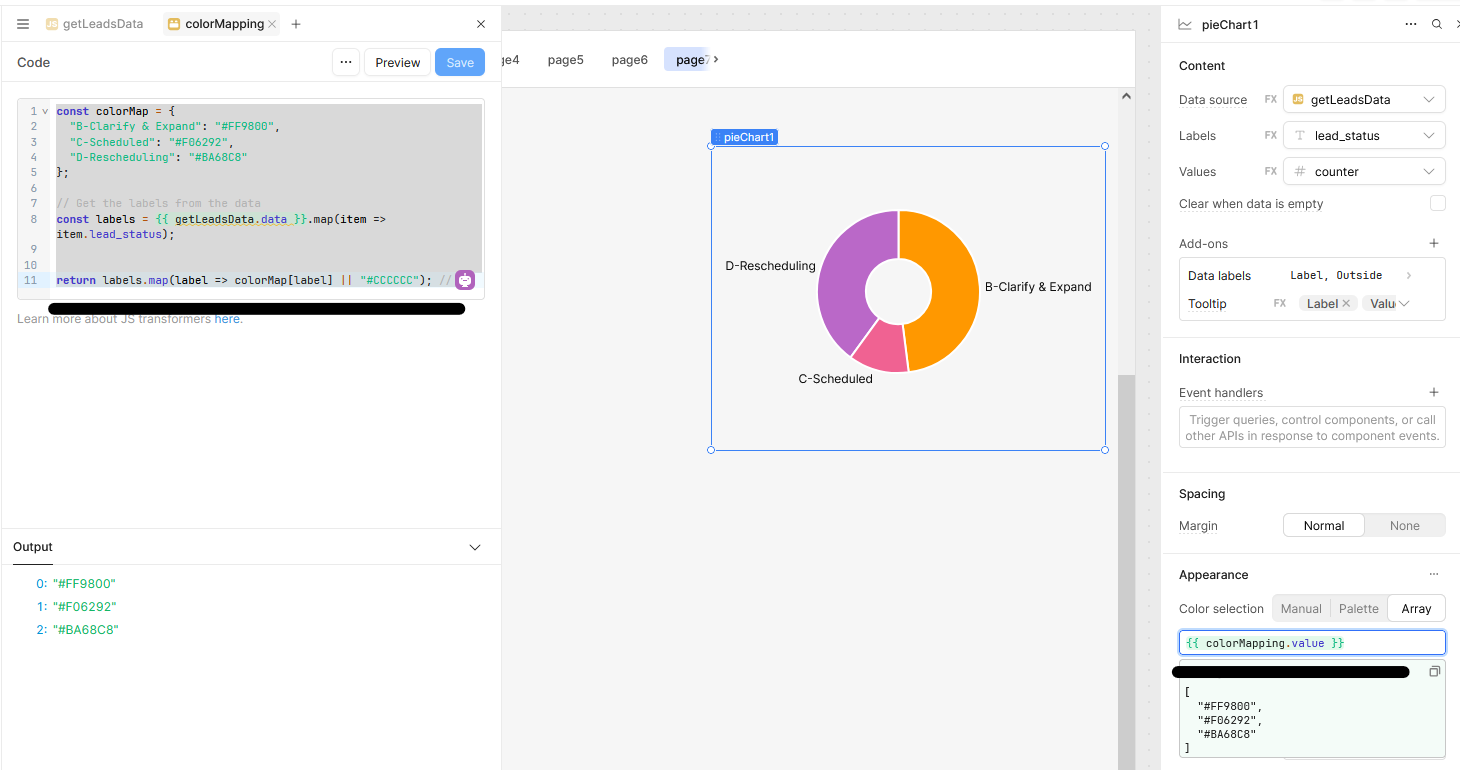
Transformer Code
const colorMap = {
  "B-Clarify & Expand": "#FF9800",
  "C-Scheduled": "#F06292",
  "D-Rescheduling": "#BA68C8"
};

// Get the labels from the data
const labels = {{ getLeadsData.data }}.map(item => item.lead_status);


return labels.map(label => colorMap[label] || "#CCCCCC"); /
=
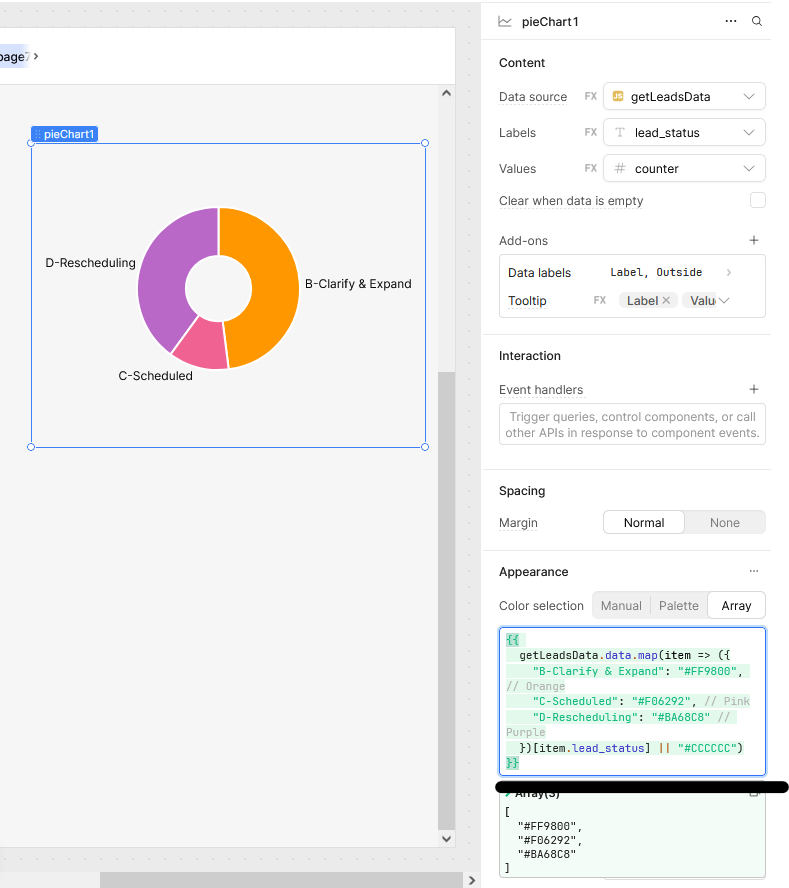
The second option is Inline Mapping in the Chart Settings
Alternatively, you can use an inline mapping directly within the chart’s color configuration:
{{
  getLeadsData.data.map(item => ({
    "B-Clarify & Expand": "#FF9800", // Orange
    "C-Scheduled": "#F06292", // Pink
    "D-Rescheduling": "#BA68C8" // Purple
  })[item.lead_status] || "#CCCCCC")
}}