I am trying to build an app with a graph component and a tooltip showing different details of that particular point. I am getting the data from my query names as RT_TT.
This query returns multiple columns, and my x axis and y axis values use 2 column values out of the 5.
I am trying to show the values in other columns as a part of the tooltip when the user hovers over a certain plot in the graph (scatter plot).
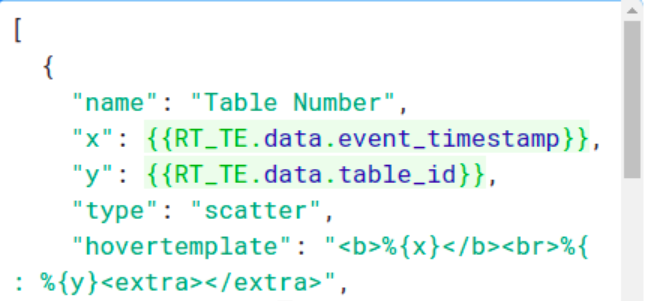
The image shows the JSON that I am using in Retool. I tried multiple ways, but it has not worked. What would be the best way to do it?
@victoria can you elaborate on the text key workaround ? i have the same issue. "hoverinfo":"text goes here" works on desktop versions but not on the Retool mobile app.
And sorry for the delay here. I was trying to remember the exact solution here so I could give you a better answer, but I'm afraid this is the best I have for now
As for the code not working on Mobile when in works on Desktop, this sounds a bit strange. Would you mind sharing an export of your Mobile app so I can take a look at the code?