Hello, I have some dummy data I would like to display in my retool Application using a heatmap generated by PoltlyJson. I followed the guide from the [Poltly Heatmaps], (Heatmaps in JavaScript).
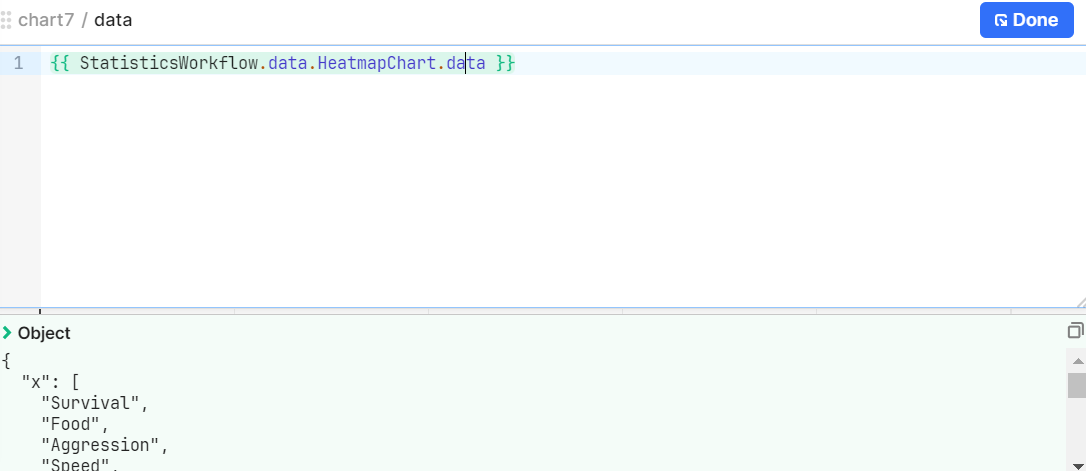
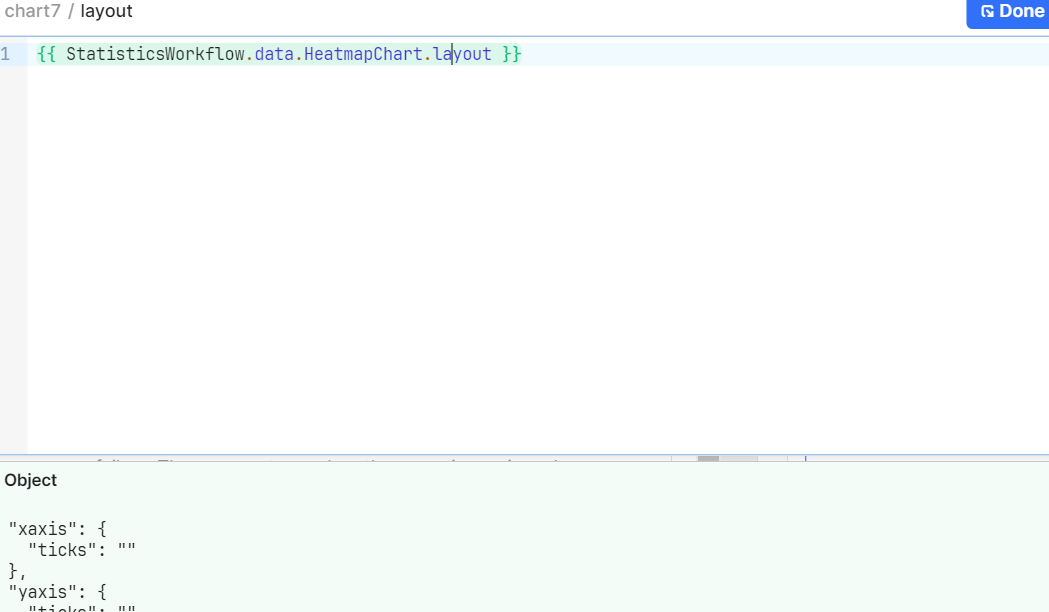
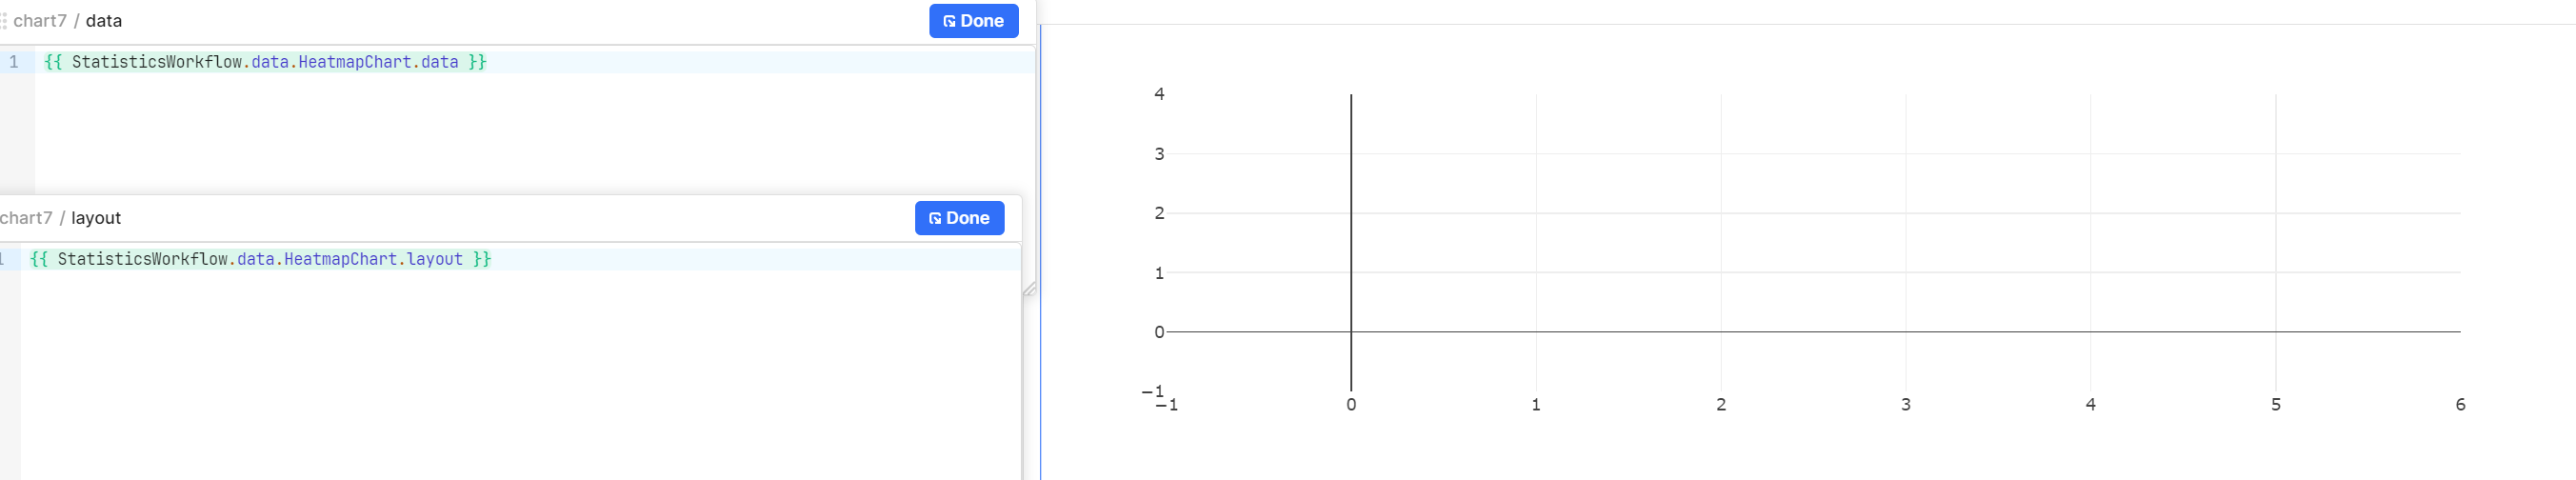
The way this is done is through a workflow. The workflow executes the code below and sends it to the application. However, I am facing an issue, the heatmap is not showing up on the chart component as my previous charts have. Below is the snippet of code that runs in the workflow and a picture of the result in the application after running the workflow and calling the data and layout objects.
var data ={
  x: ["Survival","Food","Aggression","Speed","Force"],
  y: ["Cow","Tiger","Lion","Sheep","Alliagtor"],
  z: [[0.4,0.65,0.78],[0.46,0.87,0.34],[0.35,0.74,0.86],[0.67,0.54,0.56]],
  type: "heatmap",
  colorscale: "Viridis",
  showscale: false
};

var layout = {
  annotations: [],
  xaxis: {ticks: ""},
  yaxis: {ticks: ""}
};

for ( var i = 0; i < yValues.length; i++ ) {
  for ( var j = 0; j < xValues.length; j++ ) {
    var currentValue = zValues[i][j];
    var textColor = 'white';
    var result = {
      xref: 'x1',
      yref: 'y1',
      x: xValues[j],
      y: yValues[i],
      text: zValues[i][j],
      font: {
        family: 'Arial',
        size: 12,
        color: 'rgb(50, 171, 96)'
      },
      showarrow: false,
      font: {
        color: textColor
      }
    };
    layout.annotations.push(result);
  }
}
return {data, layout}
I can also see that the data is being passed correctly: